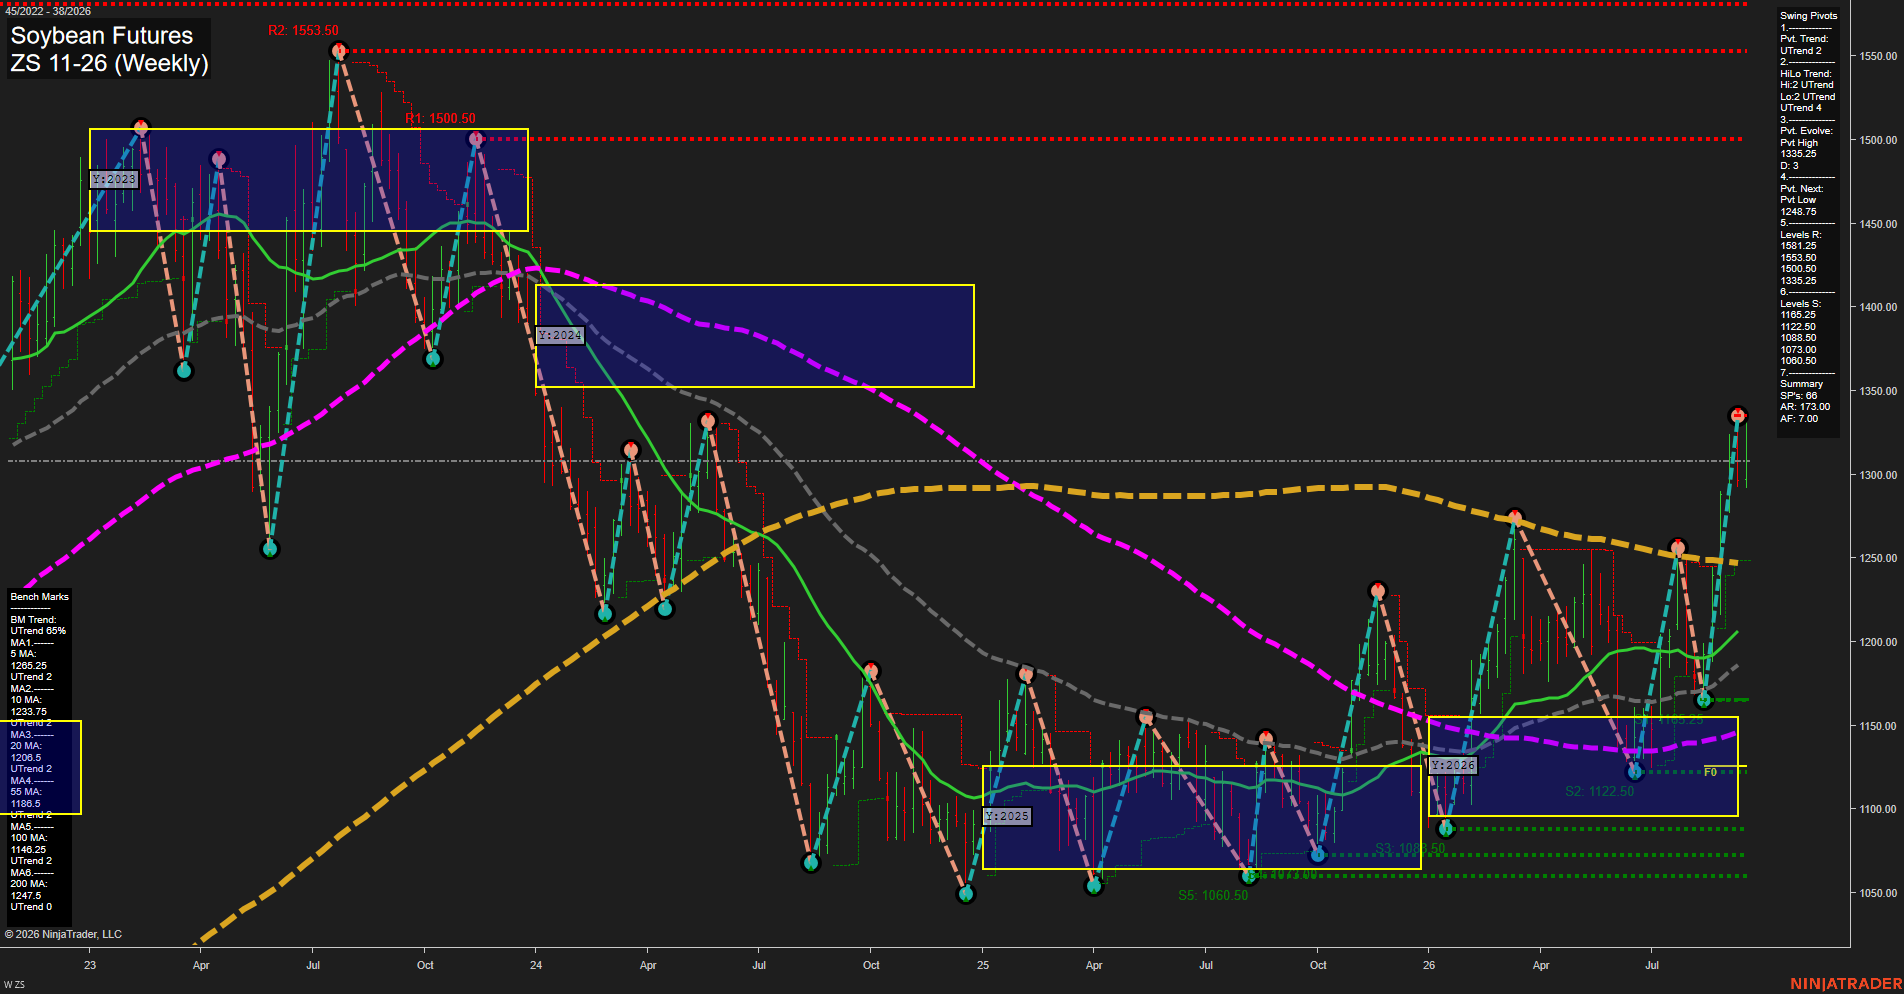
ZS Soybean Futures Weekly Chart Analysis: 2026-Sep-18 07:17 CT
Price Action
- Last: 1318,
- Bars: Large,
- Mom: fast.
WSFG Weekly
- Short-Term
- WSFG Current: 24%
- F0%/NTZ' Bias: Price Above,
- WSFG Trend: Up.
MSFG Month Sep
- Intermediate-Term
- MSFG Current: 11%
- F0%/NTZ' Bias: Price Above,
- MSFG Trend: Up.
YSFG Year 2026
- Long-Term
- YSFG Current: 62%
- F0%/NTZ' Bias: Price Above,
- YSFG Trend: Up.
Swing Pivots
- (Short-Term) 1. Pvt. Trend: UTrend,
- (Intermediate-Term) 2. HiLo Trend: UTrend,
- 3. Pvt. Evolve: Pvt high 1318.25,
- 4. Pvt. Next: Pvt low 1248.75,
- 5. Levels R: 1581.25, 1533.50, 1500.50, 1335.25,
- 6. Levels S: 1165.25, 1122.50, 1088.50, 1073.00, 1060.50.
Weekly Benchmarks
- (Short-Term) 5 Day: 1265.25 Up Trend,
- (Short-Term) 10 Day: 1233.75 Up Trend,
- (Intermediate-Term) 20 Day: 1209.50 Up Trend,
- (Intermediate-Term) 55 Day: 1186.50 Up Trend,
- (Long-Term) 100 Day: 1146.25 Up Trend,
- (Long-Term) 200 Day: 1247.50 Up Trend.
Recent Trade Signals
- 17 Sep 2026: Long ZS 11-26 @ 1318 Signals.USAR-MSFG
- 11 Sep 2026: Short ZS 11-26 @ 1296.25 Signals.USAR.TR120
- 11 Sep 2026: Short ZS 11-26 @ 1306 Signals.USAR-WSFG
Overall Rating
- Short-Term: Bullish,
- Intermediate-Term: Bullish,
- Long-Term: Bullish.
Key Insights Summary
The weekly structure has shifted into a fast upside continuation, with a large expansion bar lifting price above all six rising benchmark averages. Swing-pivot trend and HiLo trend are both UTrend, while the 1318.25 pivot high is approaching the 1335.25 resistance level. The recent advance follows a higher-low sequence from the 1060.50-1122.50 support region and represents a breakout from the prior broad consolidation. The short-term structure is extended after the vertical rally, but the intermediate and long-term technical alignment remains constructive with price above the weekly, monthly, and yearly F0%/NTZ reference areas.
Chart Analysis ATS AI Generated: 2026-09-18 07:17 for Informational use only, not trading advice. Terms and Risk Disclosure Copyright © 2026. Algo Trading Systems LLC.