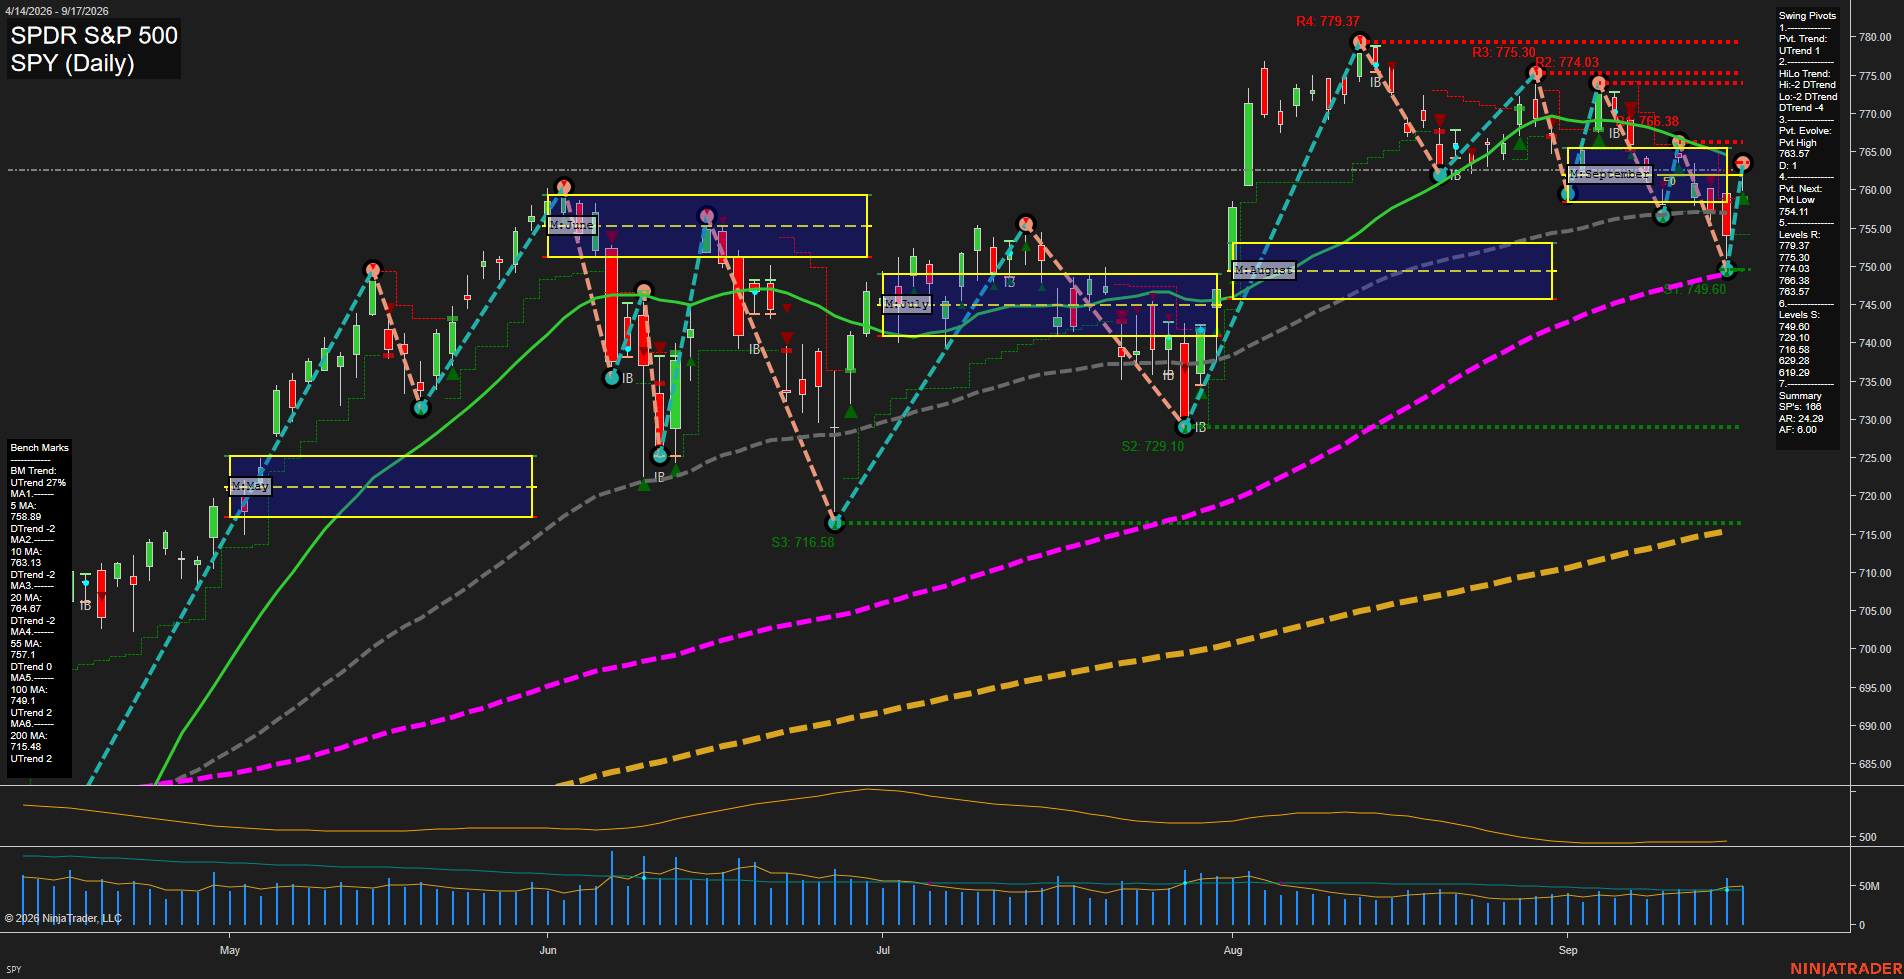
SPY SPDR S&P 500 Daily Chart Analysis: 2026-Sep-18 07:13 CT
Price Action
- Last: 762.38,
- Bars: Medium,
- Mom: average.
WSFG Weekly
- Short-Term
- WSFG Current: NA%
- F0%/NTZ' Bias: Price Neutral,
- WSFG Trend: Neutral.
MSFG Month Sep
- Intermediate-Term
- MSFG Current: NA%
- F0%/NTZ' Bias: Price Neutral,
- MSFG Trend: Neutral.
YSFG Year 2026
- Long-Term
- YSFG Current: NA%
- F0%/NTZ' Bias: Price Neutral,
- YSFG Trend: Neutral.
Swing Pivots
- (Short-Term) 1. Pvt. Trend: UTrend,
- (Intermediate-Term) 2. HiLo Trend: DTrend,
- 3. Pvt. Evolve: Pvt high 763.57,
- 4. Pvt. Next: Pvt low 754.11,
- 5. Levels R: 779.37, 775.30, 774.03, 766.38, 763.57,
- 6. Levels S: 749.60, 729.10, 716.58, 629.28, 619.29.
Daily Benchmarks
- (Short-Term) 5 Day: 758.39 Up Trend,
- (Short-Term) 10 Day: 763.13 Down Trend,
- (Intermediate-Term) 20 Day: 764.47 Down Trend,
- (Intermediate-Term) 55 Day: 757.10 Down Trend,
- (Long-Term) 100 Day: 749.60 Up Trend,
- (Long-Term) 200 Day: 715.48 Up Trend.
Additional Metrics
- ATR: 24.29,
- VOLMA: 50000000.
Overall Rating
- Short-Term: Neutral,
- Intermediate-Term: Bearish,
- Long-Term: Bullish.
Key Insights Summary
The futures swing structure is rotational: price rebounded from the 749.60 support area and restored the short-term pivot to UTrend, but remains beneath the declining 10-day and 20-day benchmarks near 763.13-764.47. The immediate pivot-high area at 763.57 and resistance band from 766.38 through 775.30 define the overhead supply zone. Intermediate structure remains DTrend following the September sequence of lower highs, while the rising 100-day and 200-day averages preserve a constructive longer-term index trend. ATR near 24.29 reflects elevated daily range conditions, consistent with choppy two-sided ES-style swings rather than a smooth directional continuation.
Chart Analysis ATS AI Generated: 2026-09-18 07:13 for Informational use only, not trading advice. Terms and Risk Disclosure Copyright © 2026. Algo Trading Systems LLC.