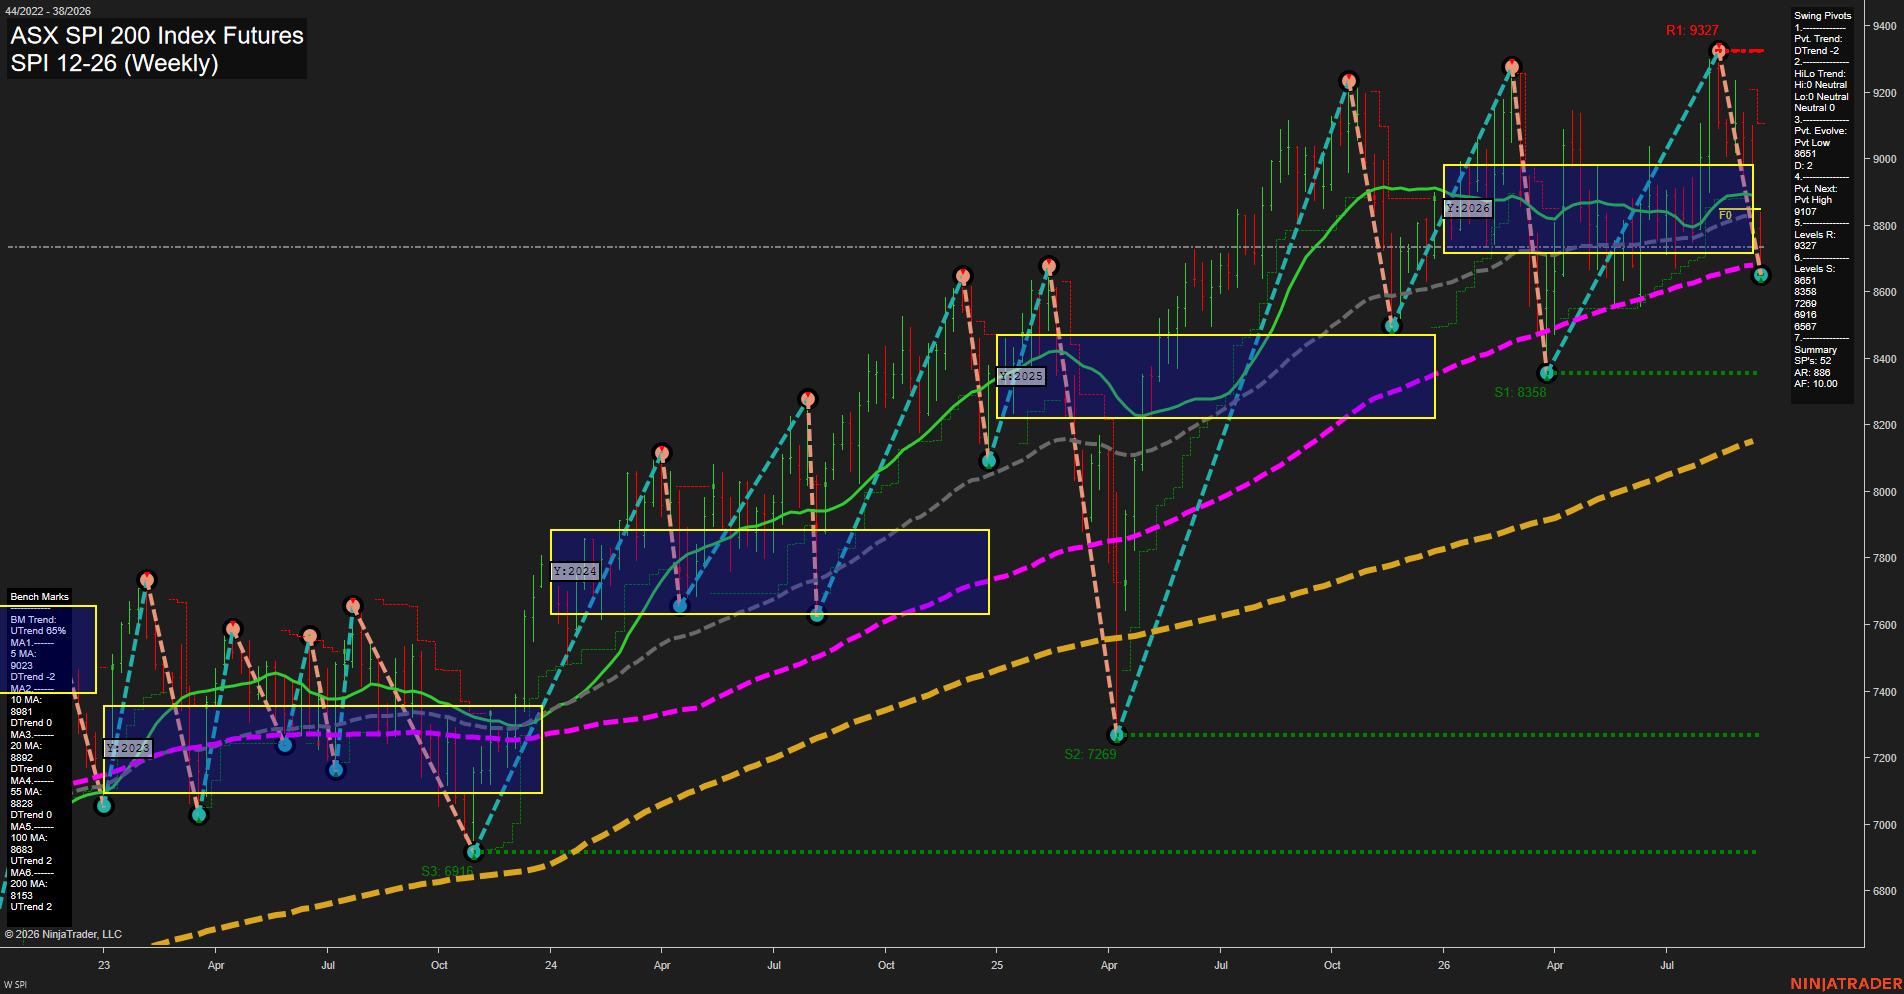
SPI ASX SPI 200 Index Futures Weekly Chart Analysis: 2026-Sep-18 07:12 CT
Price Action
- Last: 8751,
- Bars: Large,
- Mom: fast.
WSFG Weekly
- Short-Term
- WSFG Current: NA%
- F0%/NTZ' Bias: Price Below F0%,
- WSFG Trend: Down.
MSFG Month Sep
- Intermediate-Term
- MSFG Current: NA%
- F0%/NTZ' Bias: Price Below F0%,
- MSFG Trend: Down.
YSFG Year 2026
- Long-Term
- YSFG Current: NA%
- F0%/NTZ' Bias: Price Below F0%,
- YSFG Trend: Down.
Swing Pivots
- (Short-Term) 1. Pvt. Trend: DTrend,
- (Intermediate-Term) 2. HiLo Trend: Neutral,
- 3. Pvt. Evolve: Pvt low 8651,
- 4. Pvt. Next: Pvt high 9107,
- 5. Levels R: 9327,
- 6. Levels S: 8651, 8358, 7269, 6916, 6567.
Weekly Benchmarks
- (Short-Term) 5 Day: 9023 Down Trend,
- (Short-Term) 10 Day: 8981 Down Trend,
- (Intermediate-Term) 20 Day: 8892 Down Trend,
- (Intermediate-Term) 55 Day: 8828 Down Trend,
- (Long-Term) 100 Day: 8683 Down Trend,
- (Long-Term) 200 Day: 8153 Up Trend.
Overall Rating
- Short-Term: Bearish,
- Intermediate-Term: Bearish,
- Long-Term: Bullish.
Key Insights Summary
The weekly structure is in a fast counter-trend selloff from the 9327 swing high, with large bars driving price below the 5, 10, 20, and 55 period benchmarks and beneath the yearly F0% area. The active short-term pivot is a DTrend, while the intermediate HiLo structure remains neutral rather than fully bearish. Price is holding just above the 8651 pivot-low support after a sharp rejection from the upper yearly range; 9107 is the next pivot reversal reference, while 9327 remains the dominant resistance. The longer-term backdrop remains constructive because price is still above the rising 200 period benchmark and well above the major 8358 support zone, although the declining 100 period benchmark shows that the current pullback has materially weakened long-term momentum.
Chart Analysis ATS AI Generated: 2026-09-18 07:13 for Informational use only, not trading advice. Terms and Risk Disclosure Copyright © 2026. Algo Trading Systems LLC.