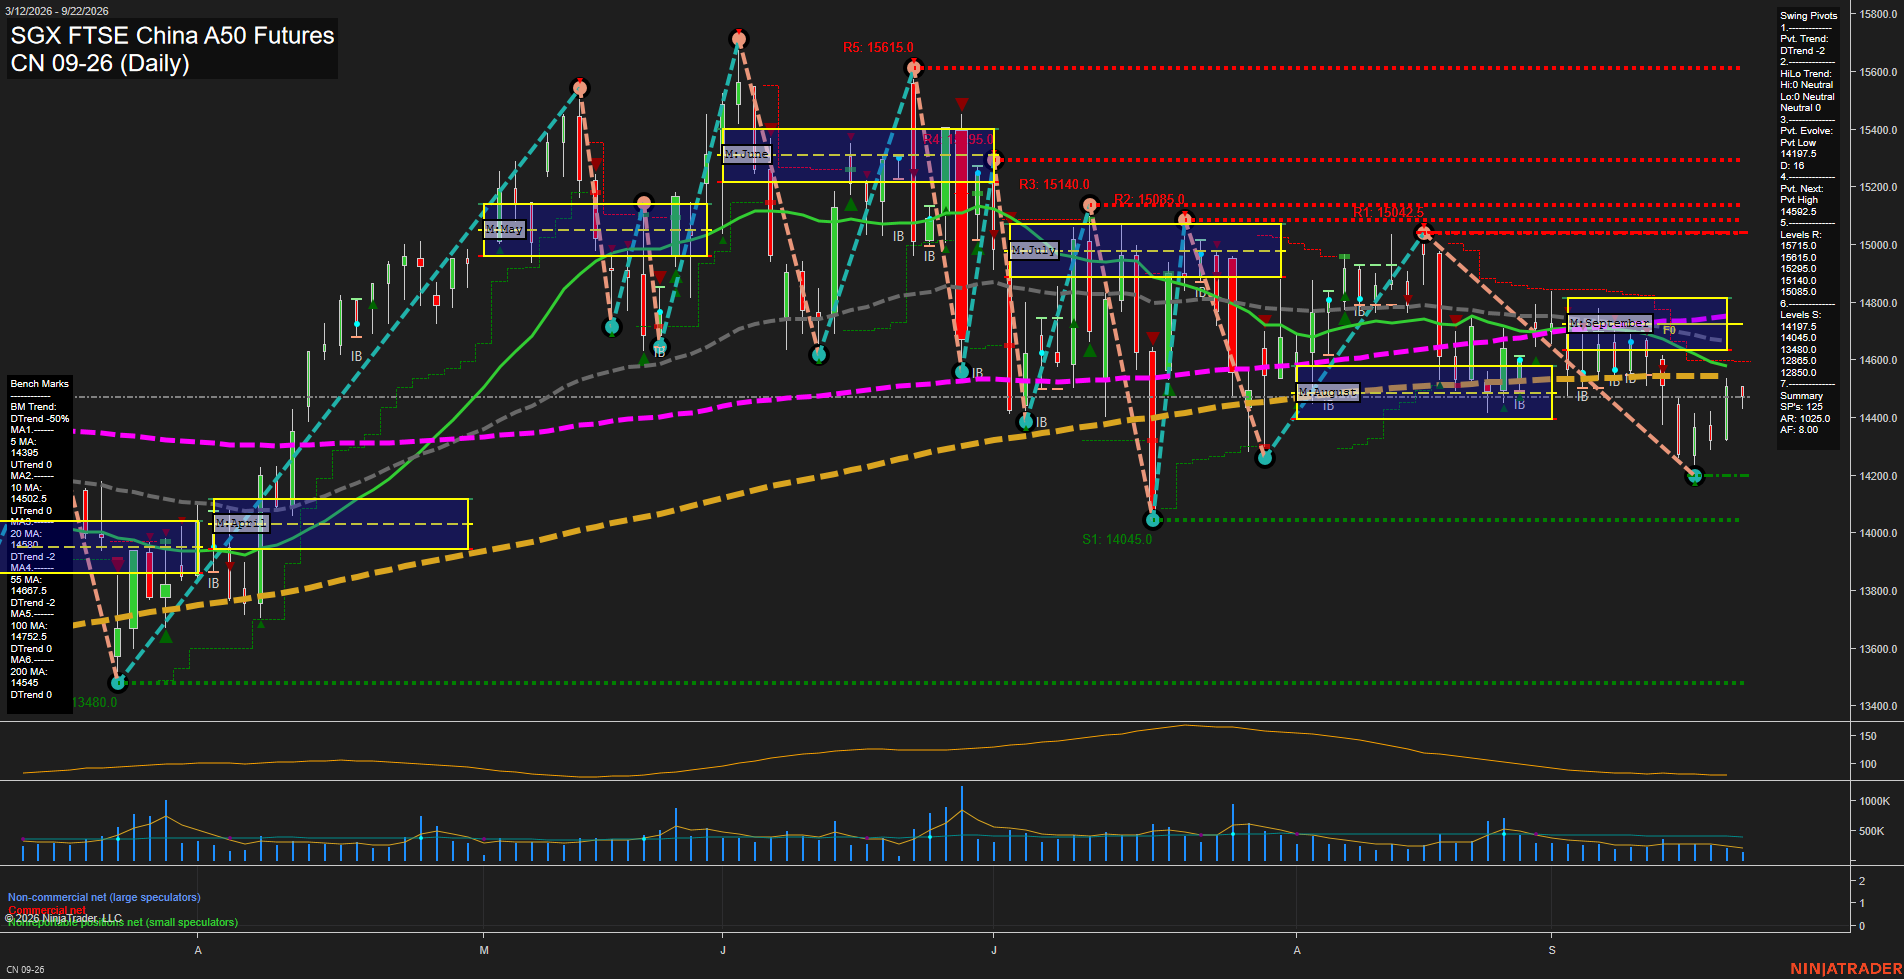
CN SGX FTSE China A50 Futures Daily Chart Analysis: 2026-Sep-18 07:03 CT
Price Action
- Last: 14595.0,
- Bars: Medium,
- Mom: Average.
WSFG Weekly
- Short-Term
- WSFG Current: NA%
- F0%/NTZ' Bias: Price Neutral,
- WSFG Trend: Neutral.
MSFG Month Sep
- Intermediate-Term
- MSFG Current: NA%
- F0%/NTZ' Bias: Price Neutral,
- MSFG Trend: Neutral.
YSFG Year 2026
- Long-Term
- YSFG Current: NA%
- F0%/NTZ' Bias: Price Neutral,
- YSFG Trend: Neutral.
Swing Pivots
- (Short-Term) 1. Pvt. Trend: DTrend,
- (Intermediate-Term) 2. HiLo Trend: Neutral,
- 3. Pvt. Evolve: Pvt low 14197.5,
- 4. Pvt. Next: Pvt high 14592.5,
- 5. Levels R: 15715.0, 15295.0, 15140.0, 15085.0,
- 6. Levels S: 14197.5, 14045.0, 13480.0.
Daily Benchmarks
- (Short-Term) 5 Day: 14395.0 Up Trend,
- (Short-Term) 10 Day: 14502.5 Up Trend,
- (Intermediate-Term) 20 Day: 14590.0 Down Trend,
- (Intermediate-Term) 55 Day: 14687.5 Down Trend,
- (Long-Term) 100 Day: 14757.5 Down Trend,
- (Long-Term) 200 Day: 14545.0 Down Trend.
Additional Metrics
- ATR: 102.5,
- VOLMA: 80.00.
Overall Rating
- Short-Term: Neutral,
- Intermediate-Term: Bearish,
- Long-Term: Bearish.
Key Insights Summary
Price has rebounded from the 14197.5 pivot low and is testing the 14592.5 pivot-high reversal threshold, leaving the short-term structure mixed despite the current DTrend pivot reading. The 5- and 10-day benchmarks are rising and price is holding marginally above the 20-day average, but the declining 20-, 55-, 100-, and 200-day benchmark alignment maintains a bearish intermediate-to-long-term backdrop. September price action remains contained in the lower portion of the monthly grid, with 14687.5 to 14757.5 forming an overhead moving-average resistance band. The recent decline toward 14200 followed by a rebound reflects a counter-trend recovery inside a broader lower-high environment; 14197.5 and 14045.0 remain the principal downside swing references, while 15085.0, 15140.0, and 15295.0 are the next notable overhead pivot-resistance levels. ATR near 102.5 indicates moderate daily range expansion relative to the quieter recent volume profile.
Chart Analysis ATS AI Generated: 2026-09-18 07:04 for Informational use only, not trading advice. Terms and Risk Disclosure Copyright © 2026. Algo Trading Systems LLC.