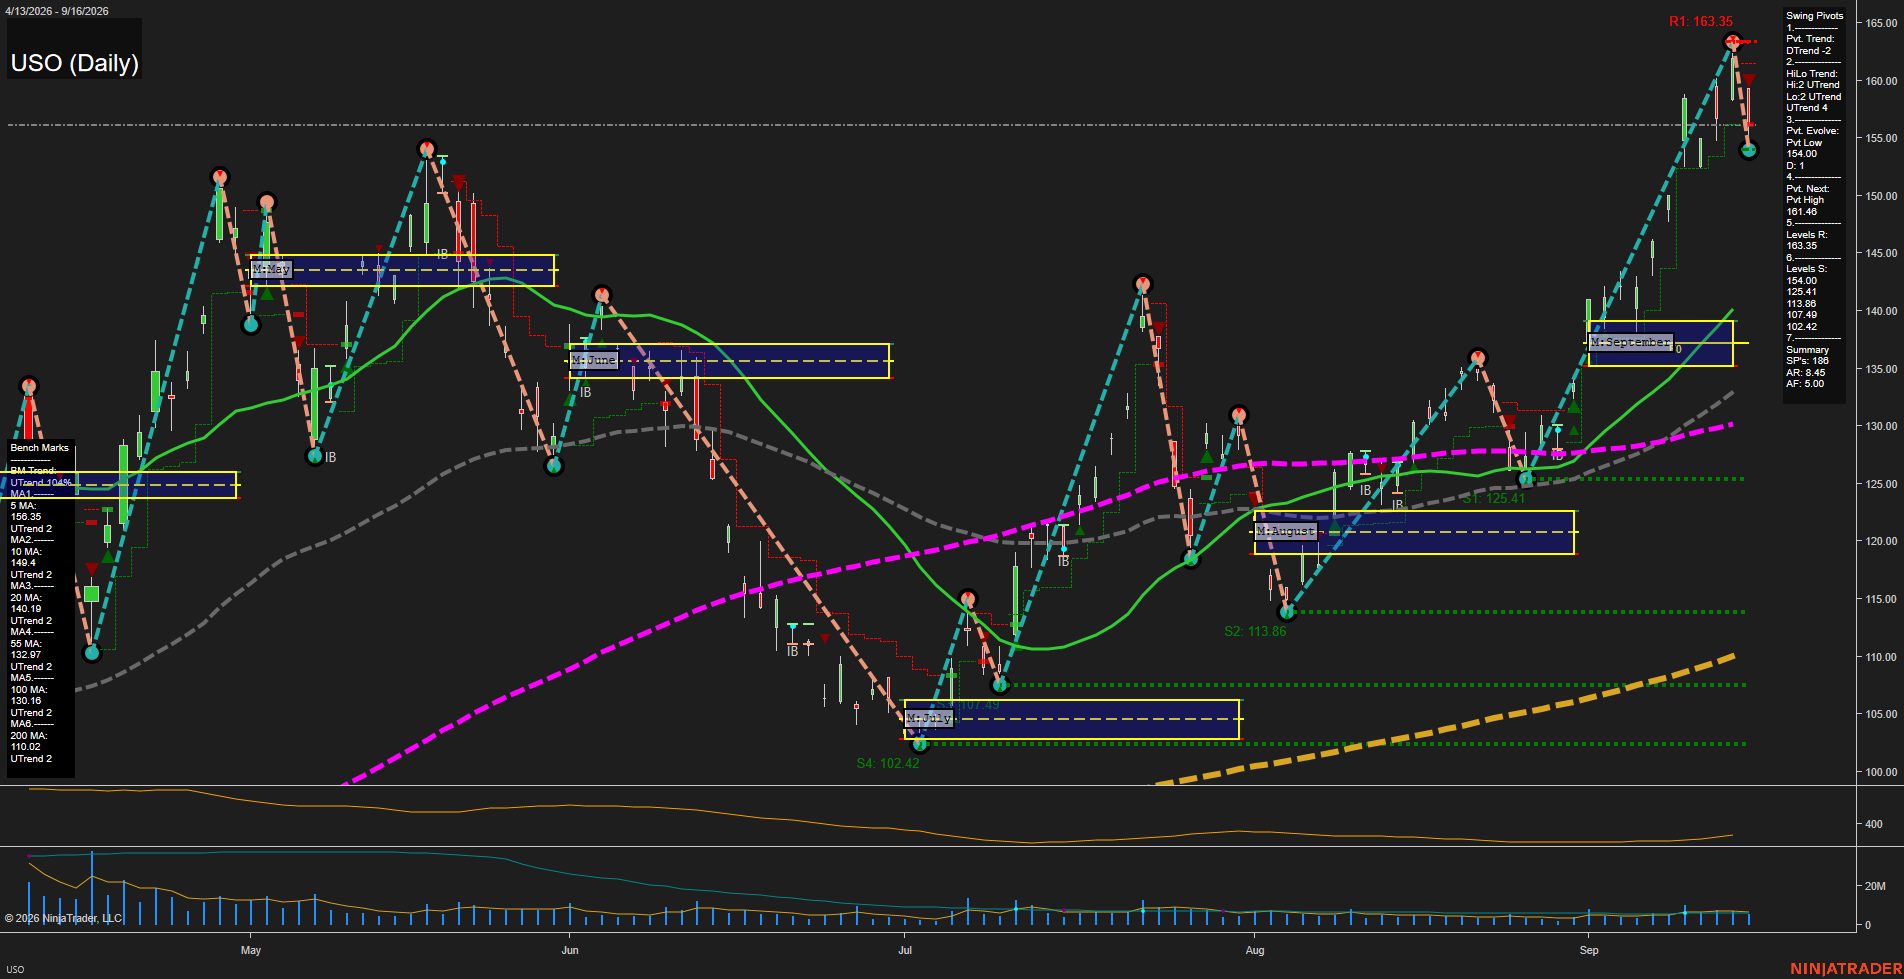
USO United States Oil Fund LP Daily Chart Analysis: 2026-Sep-17 07:15 CT
Price Action
- Last: 154.00,
- Bars: Large,
- Mom: Fast.
WSFG Weekly
- Short-Term
- WSFG Current: NA%
- F0%/NTZ' Bias: Price Neutral,
- WSFG Trend: Neutral.
MSFG Month Sep
- Intermediate-Term
- MSFG Current: 188%
- F0%/NTZ' Bias: Price Bullish,
- MSFG Trend: Bullish.
YSFG Year 2026
- Long-Term
- YSFG Current: NA%
- F0%/NTZ' Bias: Price Neutral,
- YSFG Trend: Neutral.
Swing Pivots
- (Short-Term) 1. Pvt. Trend: DTrend,
- (Intermediate-Term) 2. HiLo Trend: UTrend,
- 3. Pvt. Evolve: Pvt low 154.00,
- 4. Pvt. Next: Pvt high 161.48,
- 5. Levels R: 163.35,
- 6. Levels S: 154.41, 113.86, 107.49, 102.42.
Daily Benchmarks
- (Short-Term) 5 Day: 156.35 Up Trend,
- (Short-Term) 10 Day: 149.40 Up Trend,
- (Intermediate-Term) 20 Day: 140.90 Up Trend,
- (Intermediate-Term) 55 Day: 132.97 Up Trend,
- (Long-Term) 100 Day: 130.12 Up Trend,
- (Long-Term) 200 Day: 110.02 Up Trend.
Additional Metrics
- ATR: 5.00,
- VOLMA: 2577640.
Overall Rating
- Short-Term: Neutral,
- Intermediate-Term: Bullish,
- Long-Term: Bullish.
Key Insights Summary
USO remains in a broad futures-style upside structure, with price materially above all rising daily benchmarks and above the September monthly grid. The recent surge reached 163.35 resistance before a sharp pullback established a 154.00 pivot low, shifting the active short-term pivot condition to DTrend despite the intact intermediate higher-high and higher-low structure. The 154.41 area is the immediate structural reference, while 161.48 and 163.35 define the nearby rebound and swing-high thresholds. Large daily ranges and a 5.00 ATR reflect an expanded-volatility crude oil cycle, with the recent move resembling a strong upside impulse followed by fast consolidation rather than a completed intermediate reversal.
Chart Analysis ATS AI Generated: 2026-09-17 07:15 for Informational use only, not trading advice. Terms and Risk Disclosure Copyright © 2026. Algo Trading Systems LLC.