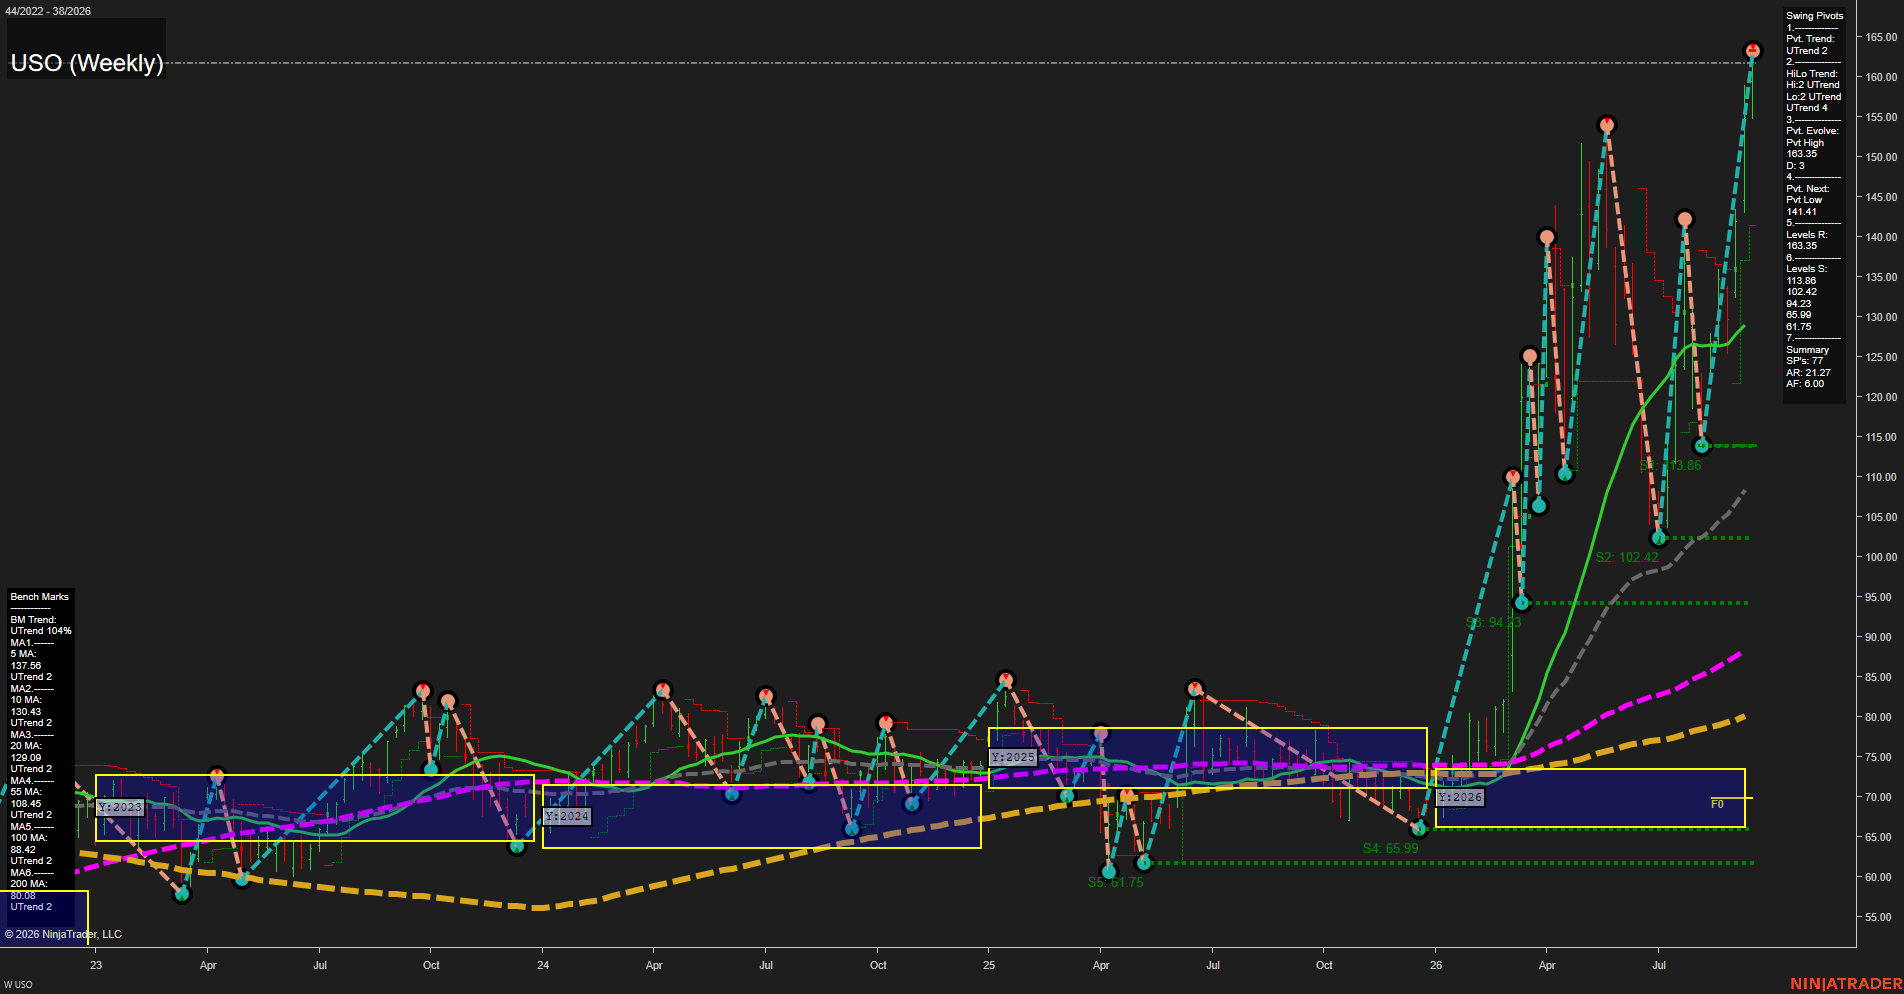
USO United States Oil Fund LP Weekly Chart Analysis: 2026-Sep-16 07:15 CT
Price Action
- Last: 163.35,
- Bars: Large,
- Mom: fast.
WSFG Weekly
- Short-Term
- WSFG Current: NA%
- F0%/NTZ' Bias: Price Above NTZ,
- WSFG Trend: UTrend.
MSFG Month Sep
- Intermediate-Term
- MSFG Current: NA%
- F0%/NTZ' Bias: Price Above NTZ,
- MSFG Trend: UTrend.
YSFG Year 2026
- Long-Term
- YSFG Current: 1867%
- F0%/NTZ' Bias: Price Above NTZ,
- YSFG Trend: UTrend.
Swing Pivots
- (Short-Term) 1. Pvt. Trend: UTrend,
- (Intermediate-Term) 2. HiLo Trend: UTrend,
- 3. Pvt. Evolve: Pvt high 163.35,
- 4. Pvt. Next: Pvt low 141.41,
- 5. Levels R: 163.35,
- 6. Levels S: 138.86, 102.42, 94.23, 65.99, 61.75.
Weekly Benchmarks
- (Short-Term) 5 Day: 137.56 Up Trend,
- (Short-Term) 10 Day: 130.43 Up Trend,
- (Intermediate-Term) 20 Day: 129.09 Up Trend,
- (Intermediate-Term) 55 Day: 108.45 Up Trend,
- (Long-Term) 100 Day: 88.42 Up Trend,
- (Long-Term) 200 Day: 80.00 Up Trend.
Overall Rating
- Short-Term: Bullish,
- Intermediate-Term: Bullish,
- Long-Term: Bullish.
Key Insights Summary
USO is in an exceptionally strong, fast-momentum weekly expansion with price at the active 163.35 pivot high and materially above every benchmark average. The pivot sequence remains higher-high/higher-low bullish, while 141.41 defines the next opposite-pivot threshold and 138.86 is the nearest established swing support. From a futures swing-trader perspective, the structure is trend-continuation bullish but extended: the wide separation from the 20-, 55-, 100-, and 200-period benchmarks reflects a powerful upside repricing cycle and elevated weekly volatility. The 2026 yearly grid has been exceeded decisively, leaving prior resistance absent above the current pivot high and making pullback behavior toward 141.41 and 138.86 the principal near-term structural reference.
Chart Analysis ATS AI Generated: 2026-09-16 07:16 for Informational use only, not trading advice. Terms and Risk Disclosure Copyright © 2026. Algo Trading Systems LLC.