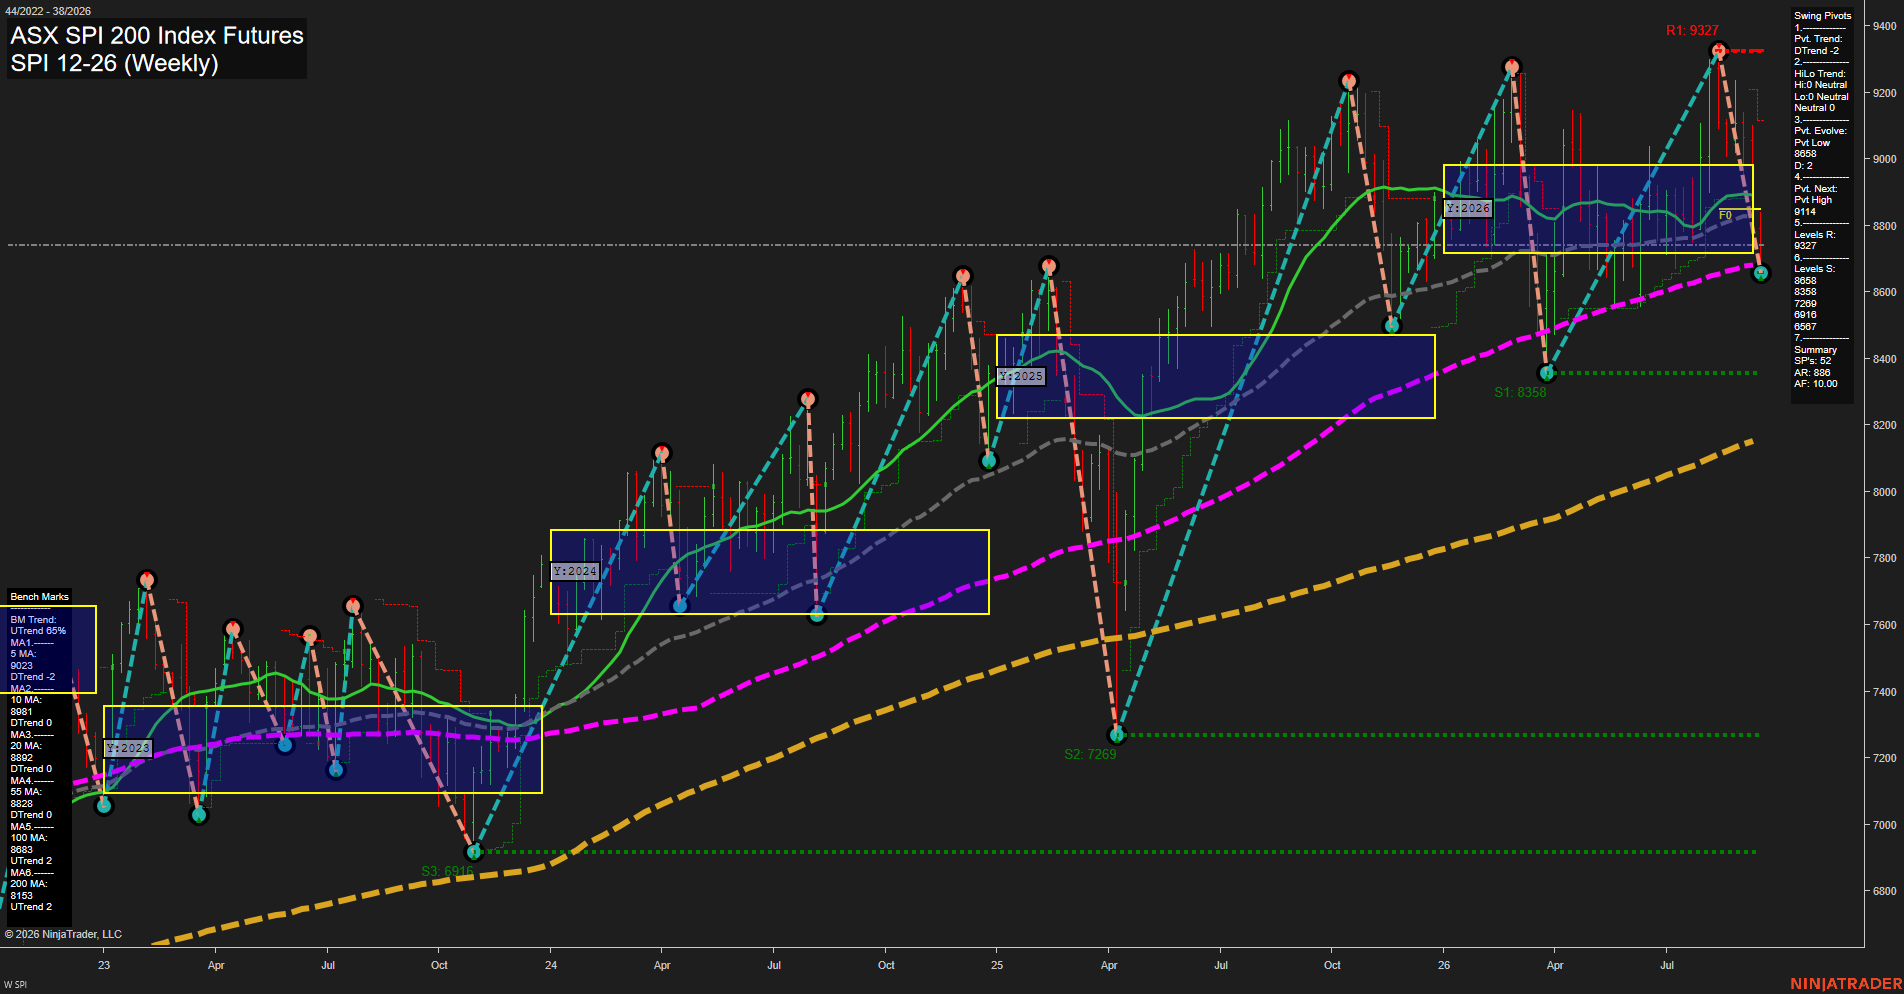
SPI ASX SPI 200 Index Futures Weekly Chart Analysis: 2026-Sep-16 07:13 CT
Price Action
- Last: 8758,
- Bars: Large,
- Mom: fast.
WSFG Weekly
- Short-Term
- WSFG Current: NA%
- F0%/NTZ' Bias: Price Neutral,
- WSFG Trend: Neutral.
MSFG Month Sep
- Intermediate-Term
- MSFG Current: NA%
- F0%/NTZ' Bias: Price Neutral,
- MSFG Trend: Neutral.
YSFG Year 2026
- Long-Term
- YSFG Current: NA%
- F0%/NTZ' Bias: Price Neutral,
- YSFG Trend: Neutral.
Swing Pivots
- (Short-Term) 1. Pvt. Trend: DTrend,
- (Intermediate-Term) 2. HiLo Trend: UTrend,
- 3. Pvt. Evolve: Pvt low 8658,
- 4. Pvt. Next: Pvt high 9114,
- 5. Levels R: 9327,
- 6. Levels S: 8658, 8358, 7269, 6916, 6567.
Weekly Benchmarks
- (Short-Term) 5 Day: 9023 Down Trend,
- (Short-Term) 10 Day: 8981 Down Trend,
- (Intermediate-Term) 20 Day: 8892 Down Trend,
- (Intermediate-Term) 55 Day: 8828 Down Trend,
- (Long-Term) 100 Day: 8683 Up Trend,
- (Long-Term) 200 Day: 8153 Up Trend.
Overall Rating
- Short-Term: Bearish,
- Intermediate-Term: Neutral,
- Long-Term: Bullish.
Key Insights Summary
SPI futures have undergone a fast, large-range weekly retracement from the 9327 pivot high, shifting the short-term pivot structure to DTrend and pushing price beneath the 5, 10, 20, and 55-week benchmarks. The decline is testing the 8658 pivot-low support area while price remains within the lower portion of the 2026 yearly neutral zone. Intermediate structure remains constructive through the broader sequence of higher swing lows and price holding above the rising 100- and 200-week benchmarks, although the current downswing is a pronounced counter-trend correction within that larger uptrend.
Chart Analysis ATS AI Generated: 2026-09-16 07:14 for Informational use only, not trading advice. Terms and Risk Disclosure Copyright © 2026. Algo Trading Systems LLC.