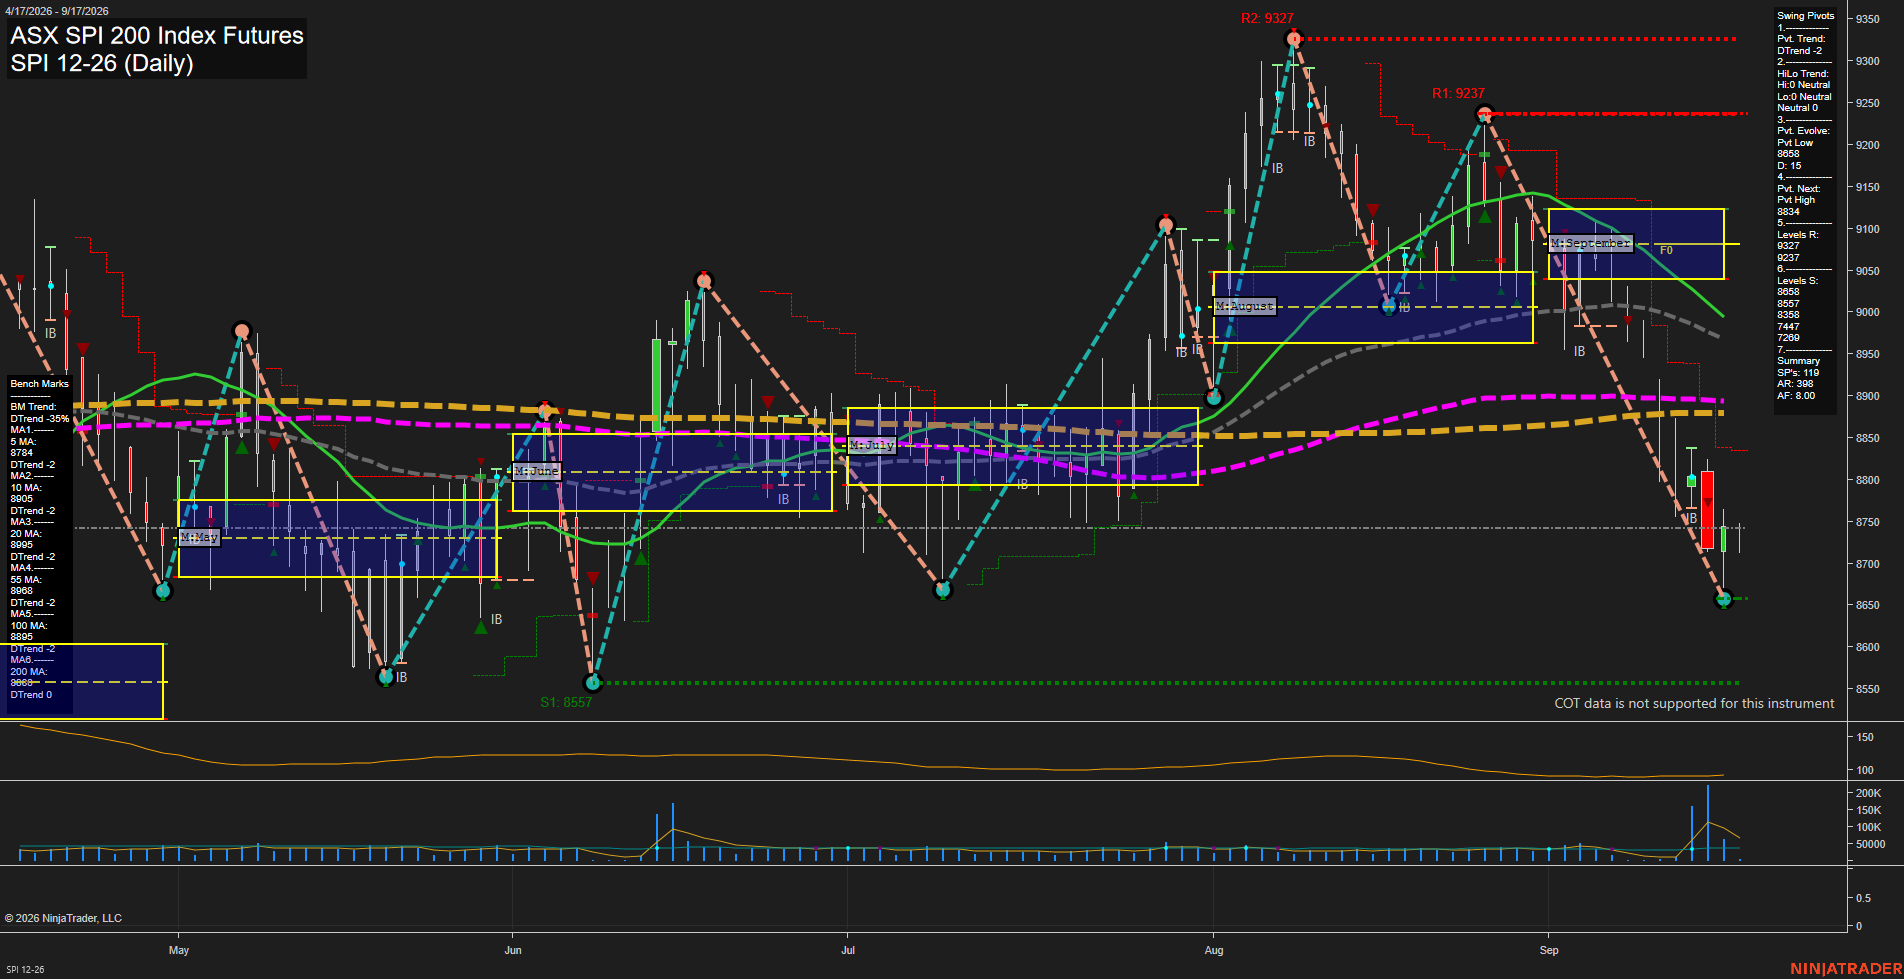
SPI ASX SPI 200 Index Futures Daily Chart Analysis: 2026-Sep-16 07:13 CT
Price Action
- Last: 8717,
- Bars: Large,
- Mom: fast.
WSFG Weekly
- Short-Term
- WSFG Current: NA%
- F0%/NTZ' Bias: Price Bearish,
- WSFG Trend: Down Trend.
MSFG Month Sep
- Intermediate-Term
- MSFG Current: NA%
- F0%/NTZ' Bias: Price Below NTZ,
- MSFG Trend: Down Trend.
YSFG Year 2026
- Long-Term
- YSFG Current: NA%
- F0%/NTZ' Bias: Price Neutral,
- YSFG Trend: Neutral.
Swing Pivots
- (Short-Term) 1. Pvt. Trend: DTrend,
- (Intermediate-Term) 2. HiLo Trend: DTrend,
- 3. Pvt. Evolve: Pvt low 8658,
- 4. Pvt. Next: Pvt high 8834,
- 5. Levels R: 9327, 9237,
- 6. Levels S: 8658, 8557, 8354, 7447, 7269.
Daily Benchmarks
- (Short-Term) 5 Day: 8784 Down Trend,
- (Short-Term) 10 Day: 8905 Down Trend,
- (Intermediate-Term) 20 Day: 8893 Down Trend,
- (Intermediate-Term) 55 Day: 8968 Down Trend,
- (Long-Term) 100 Day: 8895 Down Trend,
- (Long-Term) 200 Day: 8868 Down Trend.
Additional Metrics
Overall Rating
- Short-Term: Bearish,
- Intermediate-Term: Bearish,
- Long-Term: Bearish.
Key Insights Summary
Price is in a fast, large-range downswing and remains beneath every daily benchmark, with the moving-average structure broadly aligned lower. The 8658 pivot low is the immediate swing reference following a sharp decline from the 9237 lower-high area; 8834 is the next pivot reversal level. September price action is below the monthly NTZ and F0% zone, reflecting a decisive downside break from the prior consolidation range. Elevated volume and ATR near 98 confirm expanded participation and volatility during the selloff, while 8658, 8557, and 8354 define the descending support sequence beneath the market.
Chart Analysis ATS AI Generated: 2026-09-16 07:13 for Informational use only, not trading advice. Terms and Risk Disclosure Copyright © 2026. Algo Trading Systems LLC.