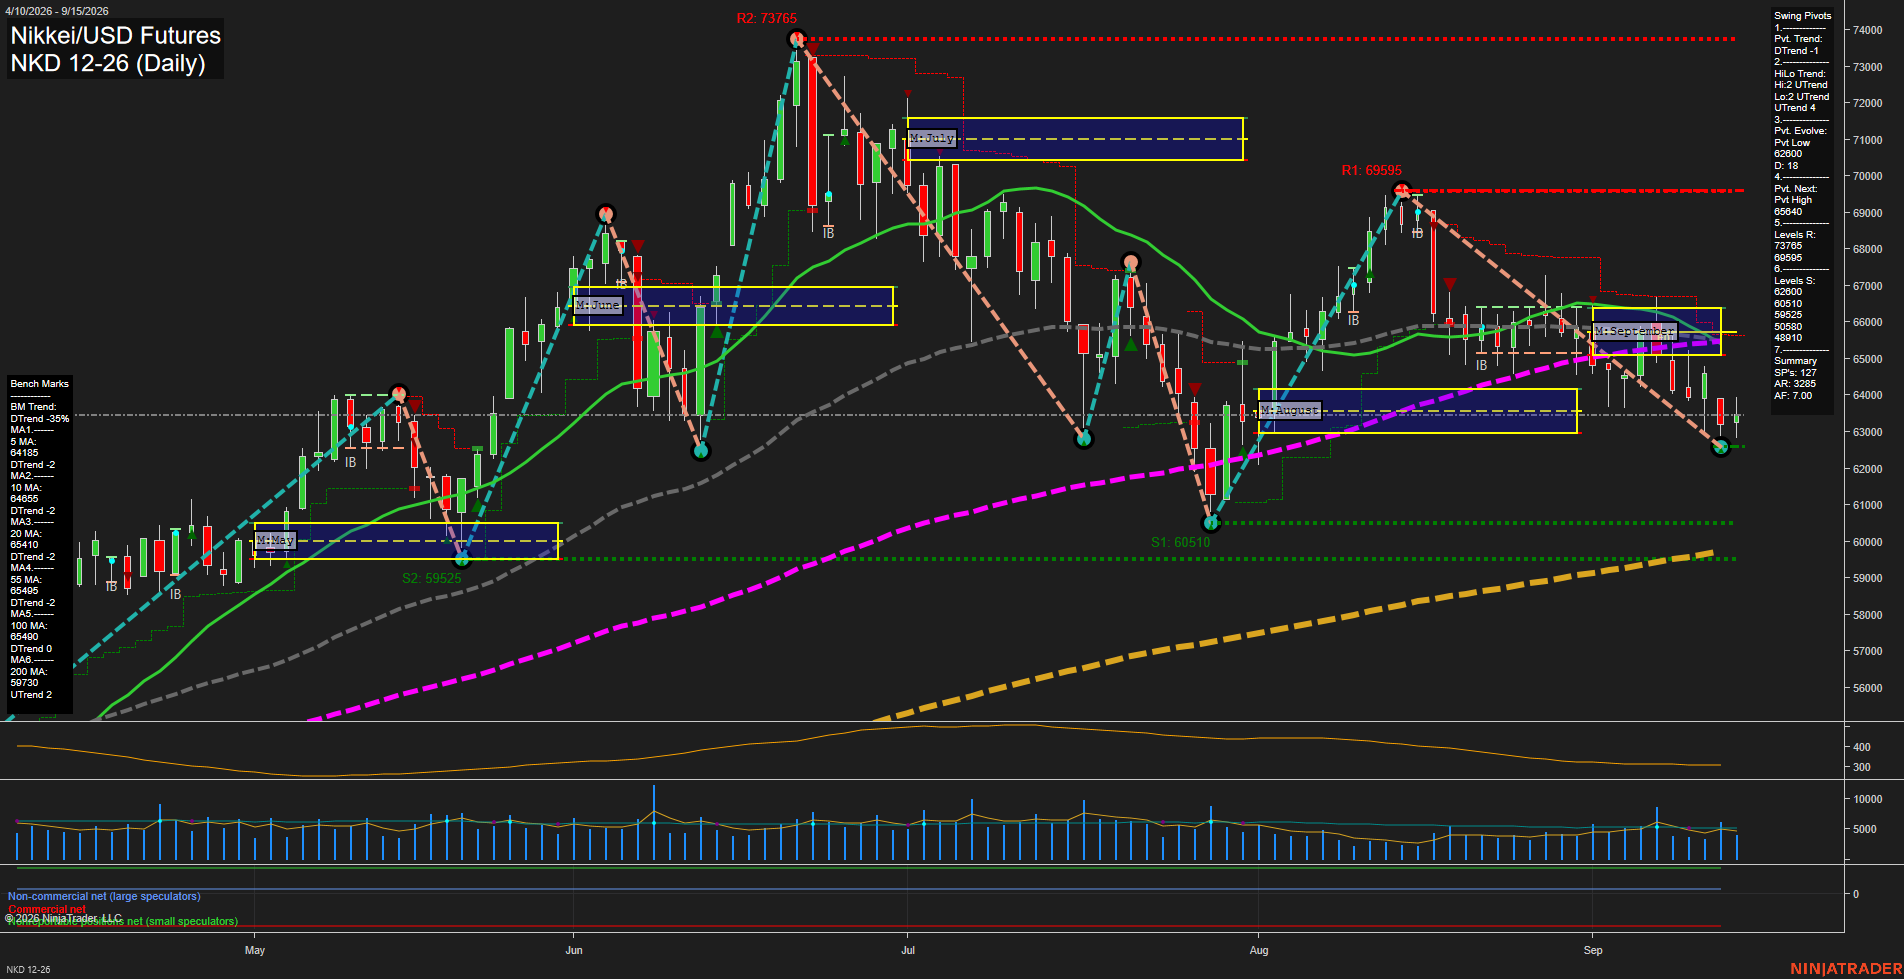
NKD Nikkei/USD Futures Daily Chart Analysis: 2026-Sep-16 07:09 CT
Price Action
- Last: 63285,
- Bars: Small,
- Mom: slow.
WSFG Weekly
- Short-Term
- WSFG Current: 10%
- F0%/NTZ' Bias: Price Above,
- WSFG Trend: Up.
MSFG Month Sep
- Intermediate-Term
- MSFG Current: -21%
- F0%/NTZ' Bias: Price Below,
- MSFG Trend: Down.
YSFG Year 2026
- Long-Term
- YSFG Current: 160%
- F0%/NTZ' Bias: Price Above,
- YSFG Trend: Up.
Swing Pivots
- (Short-Term) 1. Pvt. Trend: DTrend,
- (Intermediate-Term) 2. HiLo Trend: UTrend,
- 3. Pvt. Evolve: Pvt low 62680,
- 4. Pvt. Next: Pvt high 65640,
- 5. Levels R: 73765, 69595,
- 6. Levels S: 62680, 60510, 59525.
Daily Benchmarks
- (Short-Term) 5 Day: 64185 Down Trend,
- (Short-Term) 10 Day: 64655 Down Trend,
- (Intermediate-Term) 20 Day: 65410 Down Trend,
- (Intermediate-Term) 55 Day: 65495 Down Trend,
- (Long-Term) 100 Day: 64940 Down Trend,
- (Long-Term) 200 Day: 50730 Up Trend.
Additional Metrics
Recent Trade Signals
- 14 Sep 2026: Short NKD 12-26 @ 63300 Signals.USAR-WSFG
- 08 Sep 2026: Short NKD 09-26 @ 65325 Signals.USAR.TR120
- 08 Sep 2026: Short NKD 09-26 @ 65050 Signals.USAR-MSFG
Overall Rating
- Short-Term: Bearish,
- Intermediate-Term: Bearish,
- Long-Term: Bullish.
Key Insights Summary
NKD is in a short-term decline, with price beneath the 5, 10, 20, 55, and 100-day benchmarks and the pivot structure evolving from the 69595 high toward the 62680 swing-low area. The September MSFG remains below its F0% reference, confirming intermediate-term corrective pressure, while the weekly grid remains positive and the 200-day average continues to rise. This creates a broader long-term uptrend framework containing an active daily pullback. Recent small candles and slow momentum near 63285 indicate consolidation following the selloff, with 62680 as the immediate pivot support and 65640 as the pivot-reversal threshold.
Chart Analysis ATS AI Generated: 2026-09-16 07:10 for Informational use only, not trading advice. Terms and Risk Disclosure Copyright © 2026. Algo Trading Systems LLC.