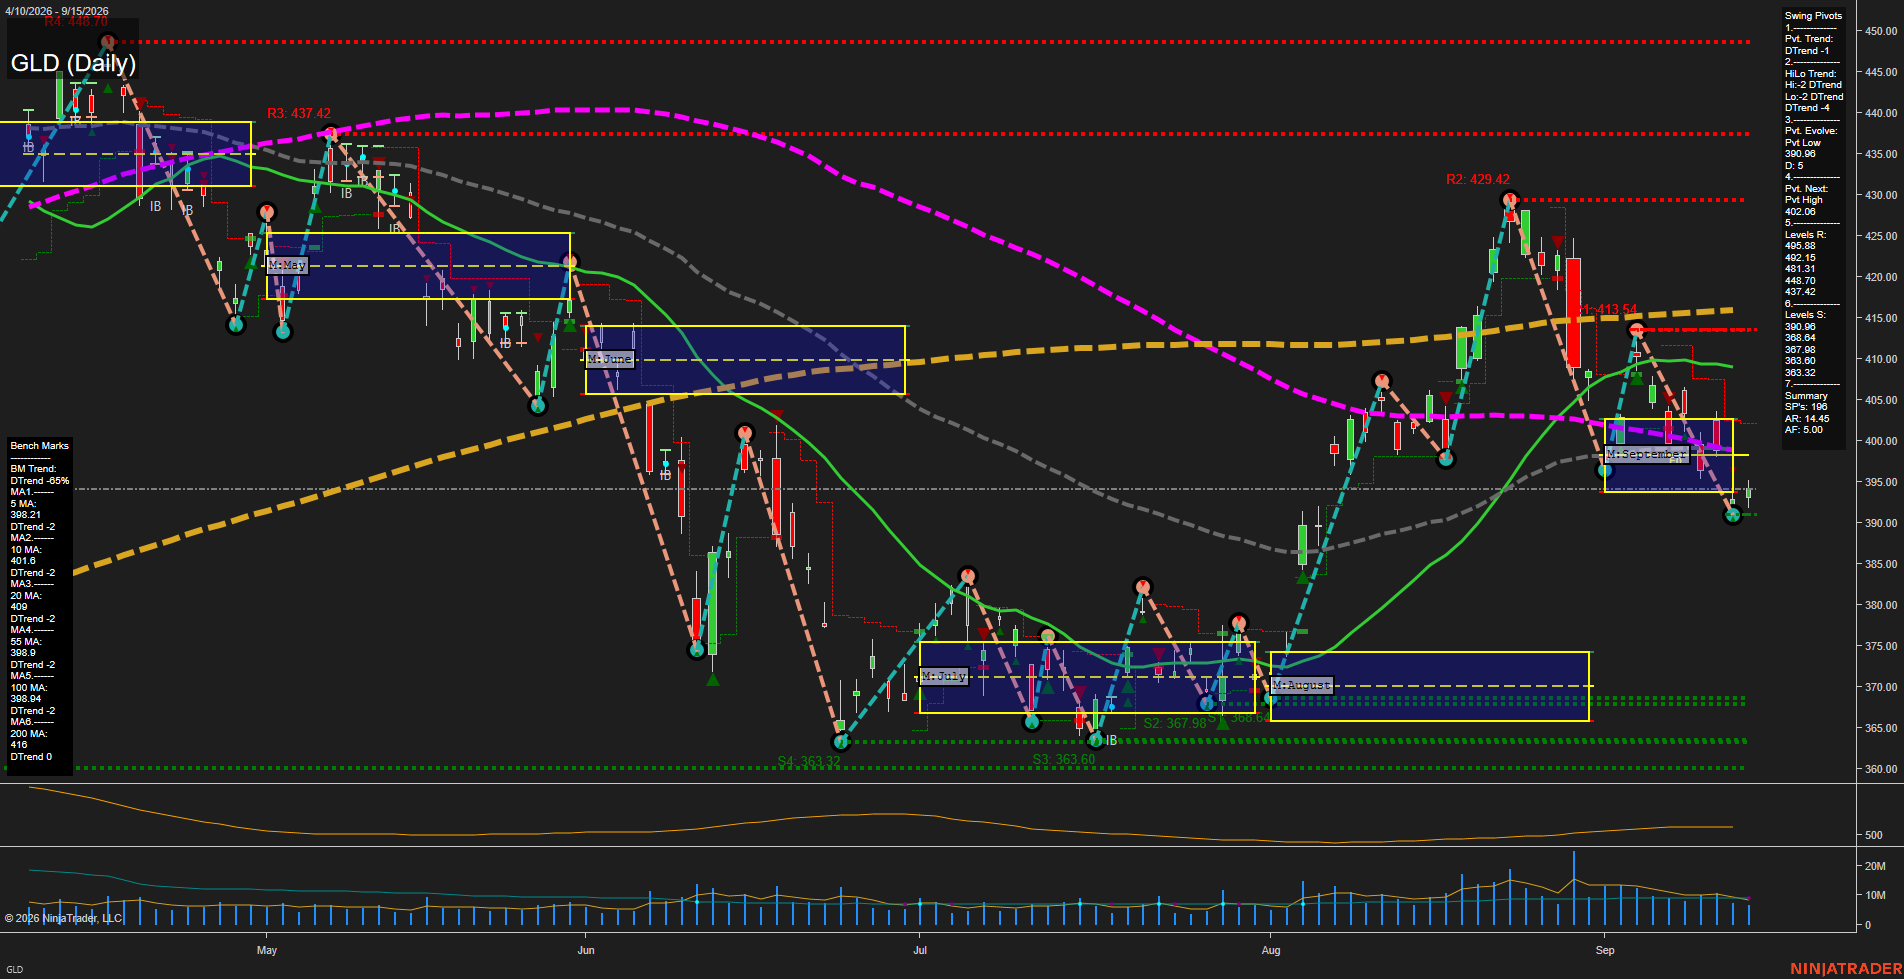
GLD SPDR Gold Shares Daily Chart Analysis: 2026-Sep-16 07:08 CT
Price Action
- Last: 394.90,
- Bars: Small,
- Mom: slow.
WSFG Weekly
- Short-Term
- WSFG Current: NA%
- F0%/NTZ' Bias: Price Neutral,
- WSFG Trend: Neutral.
MSFG Month Sep
- Intermediate-Term
- MSFG Current: NA%
- F0%/NTZ' Bias: Price Neutral,
- MSFG Trend: Neutral.
YSFG Year 2026
- Long-Term
- YSFG Current: NA%
- F0%/NTZ' Bias: Price Neutral,
- YSFG Trend: Neutral.
Swing Pivots
- (Short-Term) 1. Pvt. Trend: DTrend,
- (Intermediate-Term) 2. HiLo Trend: DTrend,
- 3. Pvt. Evolve: Pvt low 390.96,
- 4. Pvt. Next: Pvt high 402.08,
- 5. Levels R: 495.88, 492.15, 481.31, 448.70, 437.42,
- 6. Levels S: 390.96, 386.84, 367.98, 363.60, 363.32.
Daily Benchmarks
- (Short-Term) 5 Day: 398.21 Down Trend,
- (Short-Term) 10 Day: 401.60 Down Trend,
- (Intermediate-Term) 20 Day: 409.00 Down Trend,
- (Intermediate-Term) 55 Day: 398.90 Down Trend,
- (Long-Term) 100 Day: 398.00 Down Trend,
- (Long-Term) 200 Day: 416.00 Down Trend.
Additional Metrics
- ATR: 14.45,
- VOLMA: 7207880.
Overall Rating
- Short-Term: Bearish,
- Intermediate-Term: Bearish,
- Long-Term: Bearish.
Key Insights Summary
GLD reflects a futures-style corrective downswing following the late-August rejection near 429.42. Price has formed lower highs and lower lows, remains beneath every listed benchmark, and the pivot structure is aligned in DTrend across short- and intermediate-term measures. The 390.96 pivot low is the immediate downside reference, while 402.08 is the pivot-reversal threshold and aligns with the nearby moving-average congestion. Current small bars near the September NTZ lower area indicate slowed downside momentum and consolidation after the selloff, but the broader technical structure remains pressure-oriented below the 409.00 20-day and 416.00 200-day benchmarks. ATR at 14.45 indicates daily range expansion remains meaningful relative to the recent consolidation.
Chart Analysis ATS AI Generated: 2026-09-16 07:09 for Informational use only, not trading advice. Terms and Risk Disclosure Copyright © 2026. Algo Trading Systems LLC.