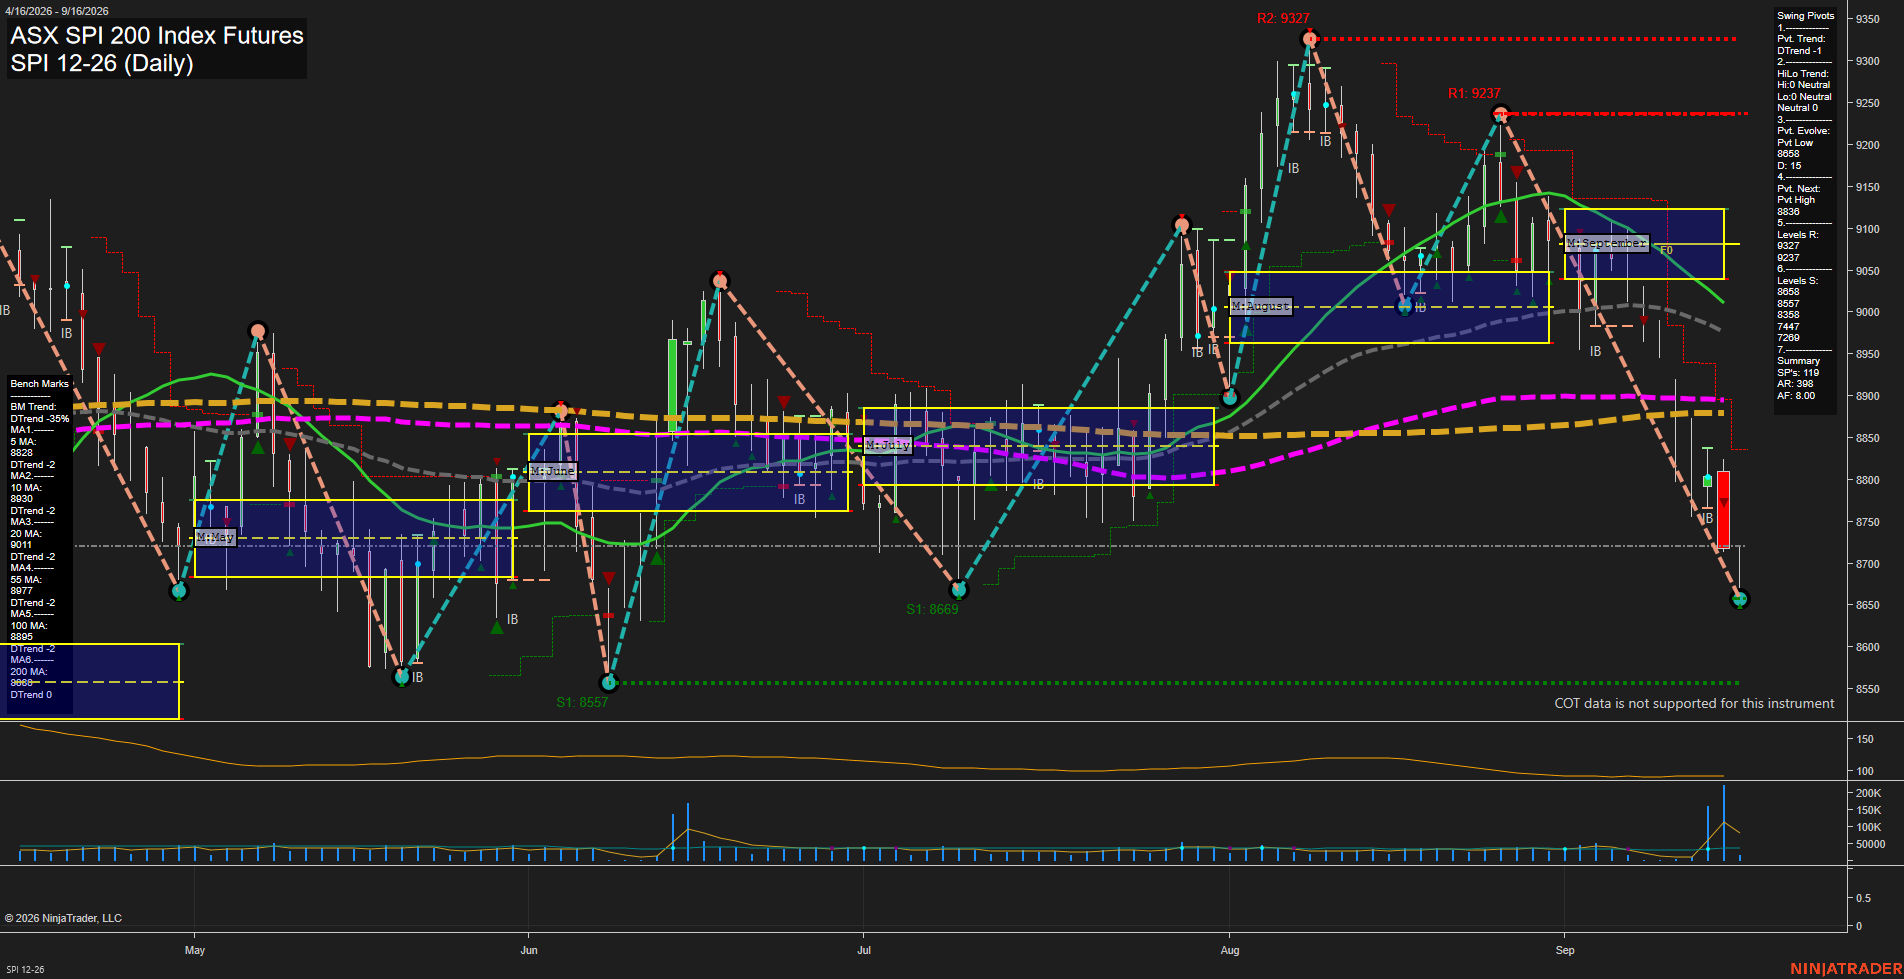
SPI ASX SPI 200 Index Futures Daily Chart Analysis: 2026-Sep-15 07:11 CT
Price Action
- Last: 8726,
- Bars: Medium,
- Mom: fast.
WSFG Weekly
- Short-Term
- WSFG Current: NA%
- F0%/NTZ' Bias: Price Neutral,
- WSFG Trend: Neutral.
MSFG Month Sep
- Intermediate-Term
- MSFG Current: NA%
- F0%/NTZ' Bias: Price Bearish,
- MSFG Trend: DTrend.
YSFG Year 2026
- Long-Term
- YSFG Current: NA%
- F0%/NTZ' Bias: Price Neutral,
- YSFG Trend: Neutral.
Swing Pivots
- (Short-Term) 1. Pvt. Trend: DTrend,
- (Intermediate-Term) 2. HiLo Trend: DTrend,
- 3. Pvt. Evolve: Pvt low 8658,
- 4. Pvt. Next: Pvt high 8836,
- 5. Levels R: 9327, 9237,
- 6. Levels S: 8658, 8557, 8358, 7447, 7269.
Daily Benchmarks
- (Short-Term) 5 Day: 8828 Down Trend,
- (Short-Term) 10 Day: 8930 Down Trend,
- (Intermediate-Term) 20 Day: 9011 Down Trend,
- (Intermediate-Term) 55 Day: 8977 Down Trend,
- (Long-Term) 100 Day: 8895 Down Trend,
- (Long-Term) 200 Day: 8688 Down Trend.
Additional Metrics
Overall Rating
- Short-Term: Bearish,
- Intermediate-Term: Bearish,
- Long-Term: Bearish.
Key Insights Summary
SPI futures remain in a fast downside swing following rejection from the 9237 pivot high. Price is below every benchmark average and below the September MSFG NTZ, confirming broad bearish alignment. The 8658 pivot low is the immediate support reference, while 8836 defines the price level required for the next short-term pivot-high evolution; 8557 is the next lower structural support. Recent elevated volume and ATR reflect an expanded-volatility decline, with the current rebound appearing counter-trend within the prevailing lower-high and lower-low structure.
Chart Analysis ATS AI Generated: 2026-09-15 07:11 for Informational use only, not trading advice. Terms and Risk Disclosure Copyright © 2026. Algo Trading Systems LLC.