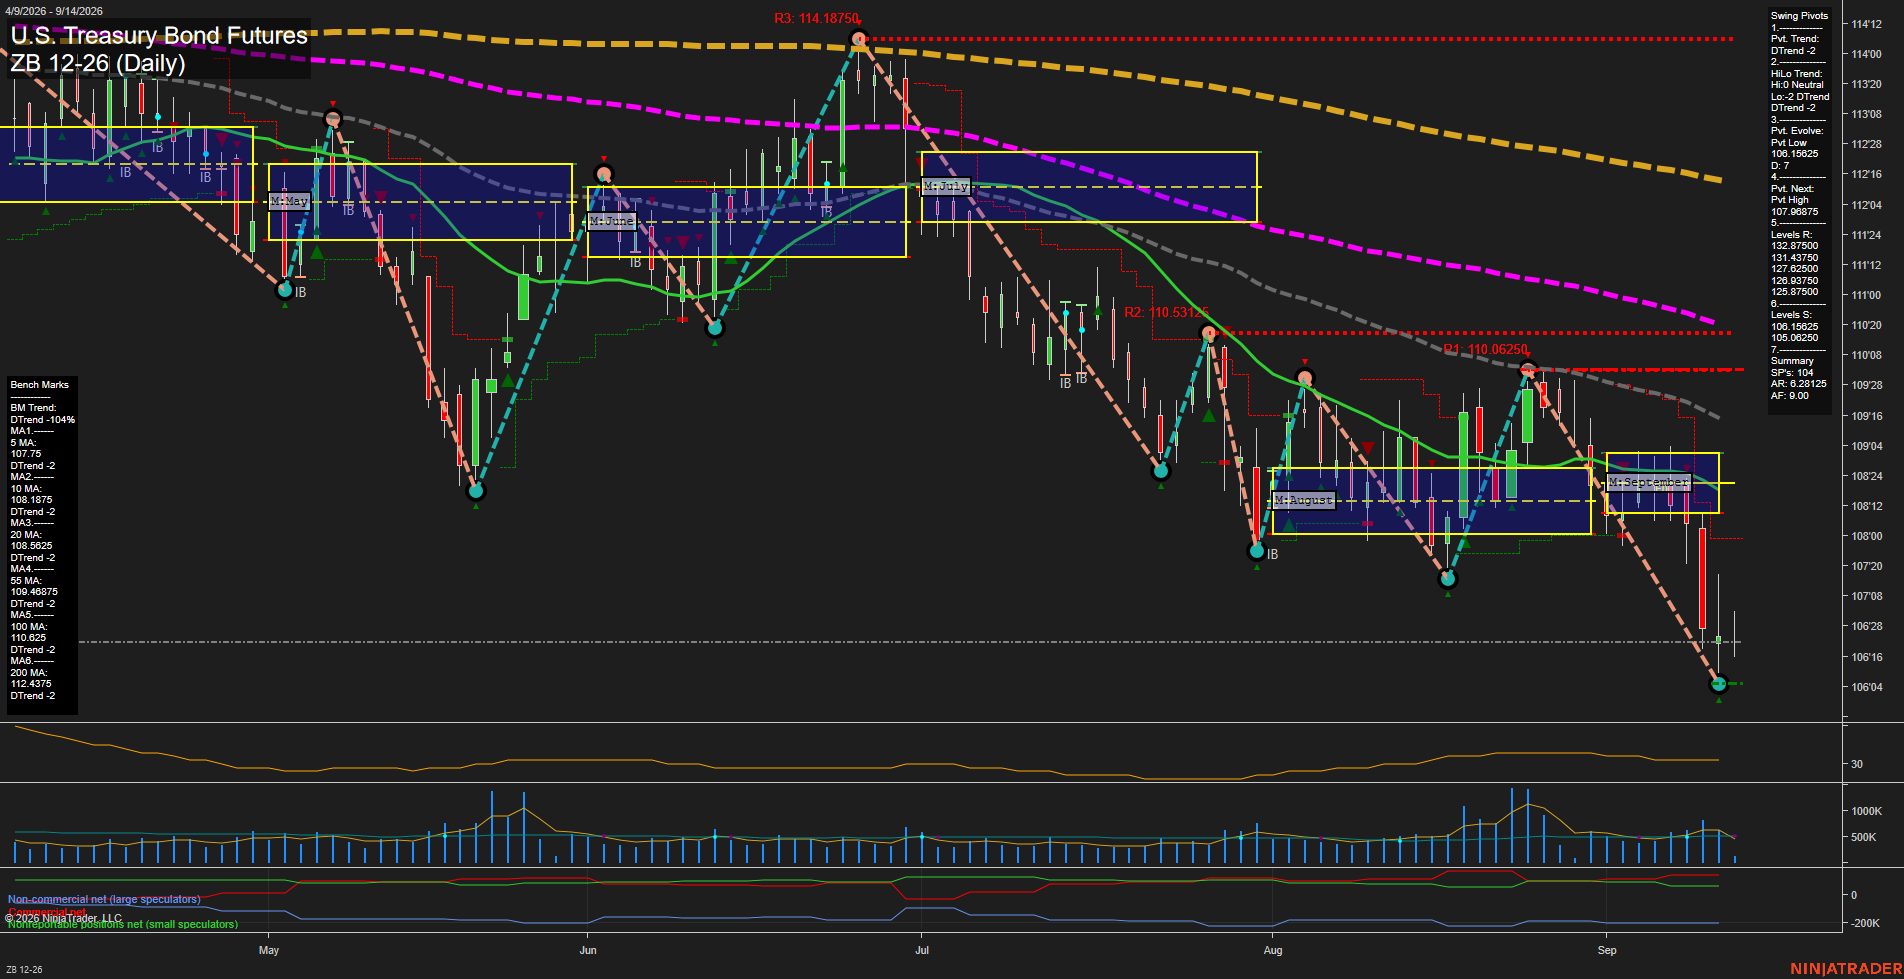
ZB U.S. Treasury Bond Futures Daily Chart Analysis: 2026-Sep-14 07:12 CT
Price Action
- Last: 106'20,
- Bars: Large,
- Mom: fast.
WSFG Weekly
- Short-Term
- WSFG Current: NA%
- F0%/NTZ' Bias: Price Bearish,
- WSFG Trend: Downtrend.
MSFG Month Sep
- Intermediate-Term
- MSFG Current: NA%
- F0%/NTZ' Bias: Price Bearish,
- MSFG Trend: Downtrend.
YSFG Year 2026
- Long-Term
- YSFG Current: NA%
- F0%/NTZ' Bias: Price Bearish,
- YSFG Trend: Downtrend.
Swing Pivots
- (Short-Term) 1. Pvt. Trend: DTrend,
- (Intermediate-Term) 2. HiLo Trend: DTrend,
- 3. Pvt. Evolve: Pvt low 106.109625,
- 4. Pvt. Next: Pvt high 107.098875,
- 5. Levels R: 132.87500, 131.43750, 128.93750, 127.62500, 125.87500,
- 6. Levels S: 106.15625, 105.06250.
Daily Benchmarks
- (Short-Term) 5 Day: 107.75 Down Trend,
- (Short-Term) 10 Day: 108.1875 Down Trend,
- (Intermediate-Term) 20 Day: 108.5625 Down Trend,
- (Intermediate-Term) 55 Day: 109.4875 Down Trend,
- (Long-Term) 100 Day: 110.625 Down Trend,
- (Long-Term) 200 Day: 112.4375 Down Trend.
Additional Metrics
Overall Rating
- Short-Term: Bearish,
- Intermediate-Term: Bearish,
- Long-Term: Bearish.
Key Insights Summary
Price has accelerated lower from the September NTZ and remains beneath the weekly and monthly Fib-grid areas. The daily pivot structure is in a DTrend, with lower highs and a newly evolving pivot low near 106.109625. The decline has pushed through the 106.15625 support area, leaving 105.06250 as the next listed lower support. All six benchmark averages are declining and positioned above price, confirming broad short-, intermediate-, and long-term downside alignment. Momentum is fast and daily bars have expanded, reflecting a directional selloff with elevated swing-range conditions; 107.098875 is the nearest pivot reversal reference.
Chart Analysis ATS AI Generated: 2026-09-14 07:13 for Informational use only, not trading advice. Terms and Risk Disclosure Copyright © 2026. Algo Trading Systems LLC.