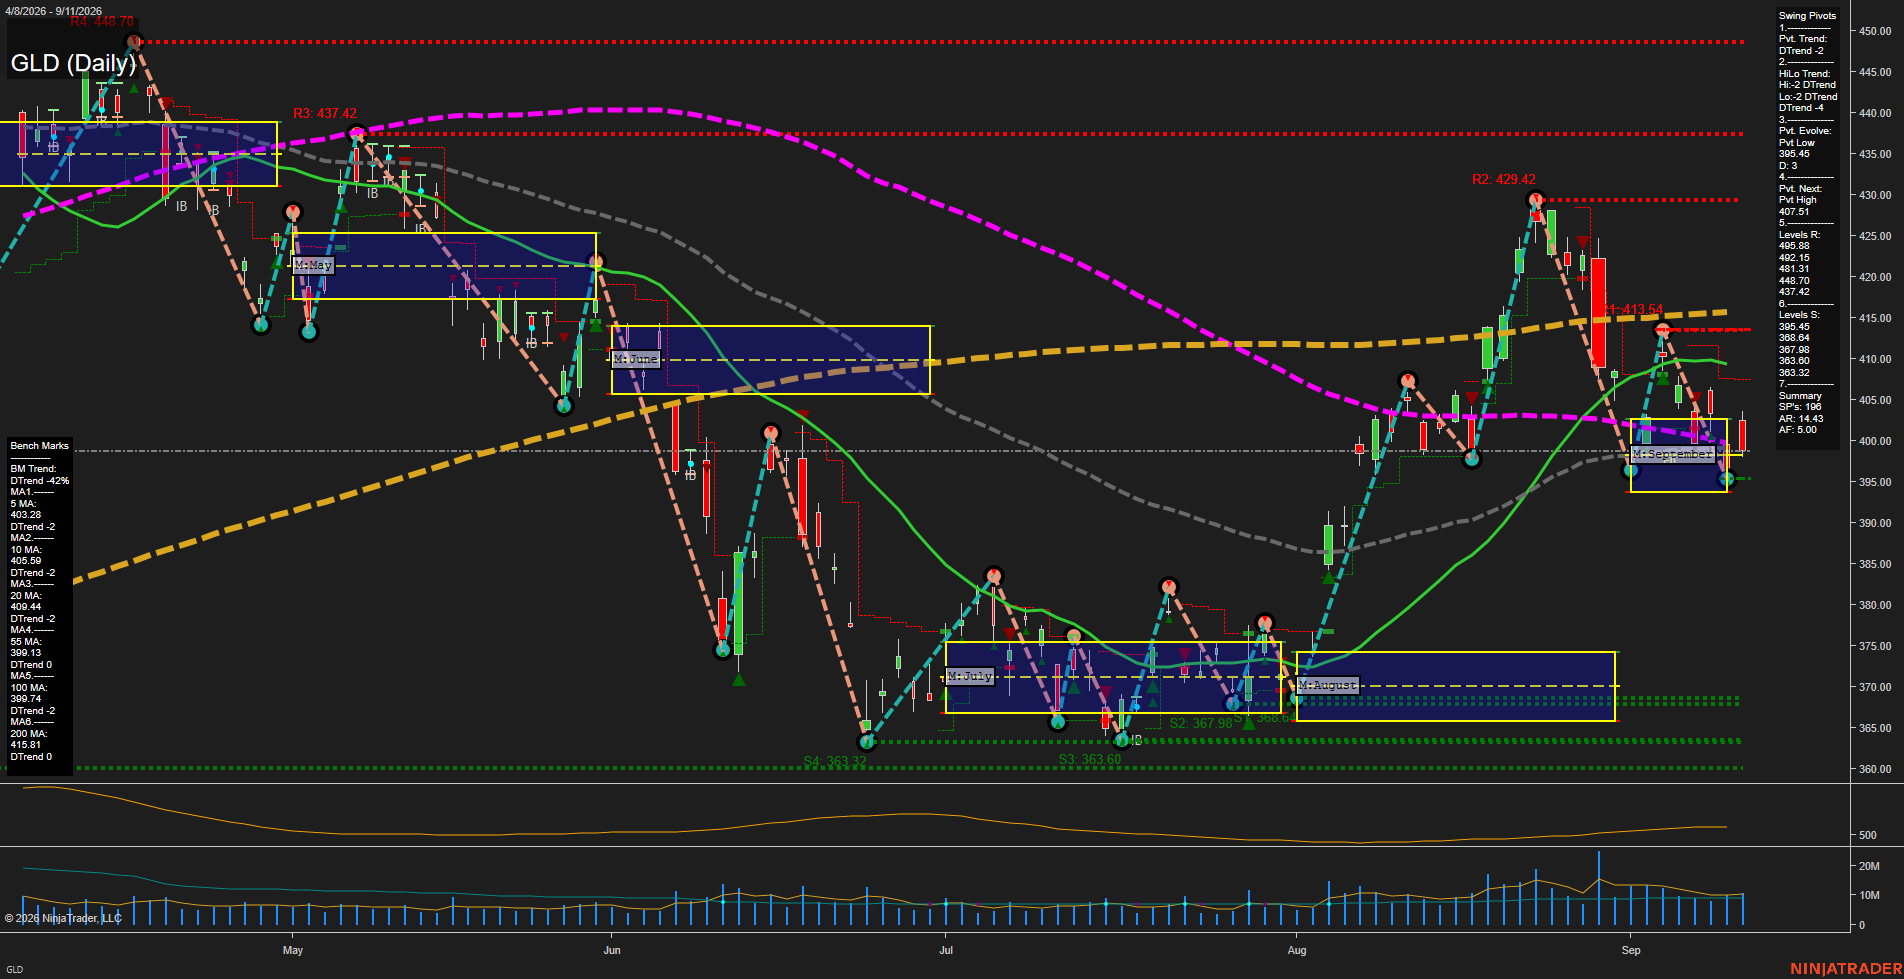
GLD SPDR Gold Shares Daily Chart Analysis: 2026-Sep-13 18:04 CT
Price Action
- Last: 402.00,
- Bars: Medium,
- Mom: Average.
WSFG Weekly
- Short-Term
- WSFG Current: NA%
- F0%/NTZ' Bias: Price Neutral,
- WSFG Trend: Neutral.
MSFG Month Sep
- Intermediate-Term
- MSFG Current: NA%
- F0%/NTZ' Bias: Price Neutral,
- MSFG Trend: Neutral.
YSFG Year 2026
- Long-Term
- YSFG Current: NA%
- F0%/NTZ' Bias: Price Neutral,
- YSFG Trend: Neutral.
Swing Pivots
- (Short-Term) 1. Pvt. Trend: DTrend,
- (Intermediate-Term) 2. HiLo Trend: DTrend,
- 3. Pvt. Evolve: Pvt low 395.45,
- 4. Pvt. Next: Pvt high 407.51,
- 5. Levels R: 495.38, 492.15, 481.31, 448.70, 437.42,
- 6. Levels S: 395.45, 368.04, 367.98, 363.60, 363.32.
Daily Benchmarks
- (Short-Term) 5 Day: 403.28 Down Trend,
- (Short-Term) 10 Day: 405.59 Down Trend,
- (Intermediate-Term) 20 Day: 409.44 Down Trend,
- (Intermediate-Term) 55 Day: 399.13 Down Trend,
- (Long-Term) 100 Day: 399.74 Down Trend,
- (Long-Term) 200 Day: 415.81 Down Trend.
Additional Metrics
- ATR: 14.43,
- VOLMA: 5000000.
Overall Rating
- Short-Term: Bearish,
- Intermediate-Term: Bearish,
- Long-Term: Bearish.
Key Insights Summary
GLD is forming a futures-swing style corrective structure following the late-August surge toward 429.42. The active pivot sequence remains DTrend, with lower highs evident beneath 413.54 and 407.51. Price has rebounded from the 395.45 pivot low and is trading near the 55-day and 100-day benchmarks, but remains below the declining 5-, 10-, 20-, and 200-day averages. The 395.45 level is the immediate swing support reference, while 407.51 is the nearest pivot reversal threshold. ATR near 14.43 reflects elevated daily range potential, consistent with a volatile consolidation after the prior sharp rally and retracement.
Chart Analysis ATS AI Generated: 2026-09-13 18:05 for Informational use only, not trading advice. Terms and Risk Disclosure Copyright © 2026. Algo Trading Systems LLC.