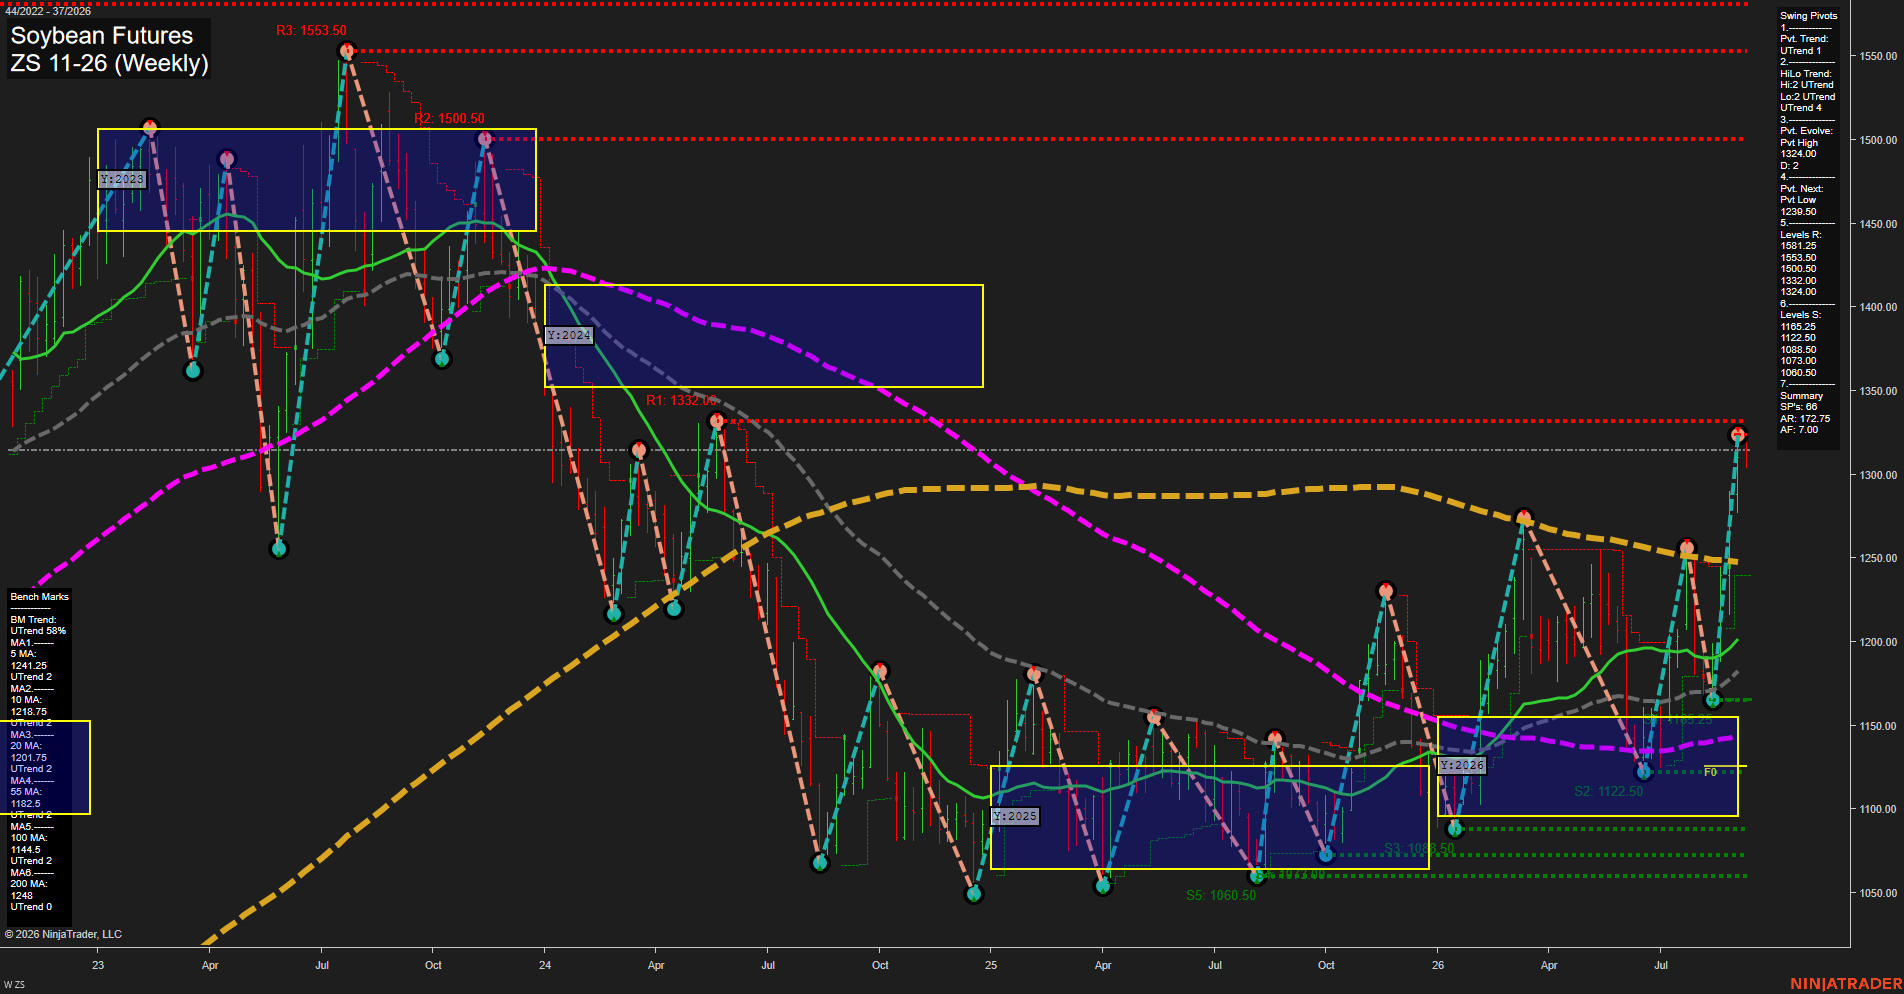
ZS Soybean Futures Weekly Chart Analysis: 2026-Sep-09 07:16 CT
Price Action
- Last: 1317.00,
- Bars: Large,
- Mom: fast.
WSFG Weekly
- Short-Term
- WSFG Current: 0%
- F0%/NTZ' Bias: Price Neutral,
- WSFG Trend: Neutral.
MSFG Month Sep
- Intermediate-Term
- MSFG Current: 17%
- F0%/NTZ' Bias: Price Above,
- MSFG Trend: Up.
YSFG Year 2026
- Long-Term
- YSFG Current: 64%
- F0%/NTZ' Bias: Price Above,
- YSFG Trend: Up.
Swing Pivots
- (Short-Term) 1. Pvt. Trend: UTrend,
- (Intermediate-Term) 2. HiLo Trend: UTrend,
- 3. Pvt. Evolve: Pvt high 1317.00,
- 4. Pvt. Next: Pvt low 1239.50,
- 5. Levels R: 1581.25, 1553.50, 1500.50, 1391.25, 1324.00,
- 6. Levels S: 1165.25, 1122.50, 1088.50, 1073.00, 1060.50.
Weekly Benchmarks
- (Short-Term) 5 Day: 1241.25 Up Trend,
- (Short-Term) 10 Day: 1218.75 Up Trend,
- (Intermediate-Term) 20 Day: 1201.75 Up Trend,
- (Intermediate-Term) 55 Day: 1182.50 Up Trend,
- (Long-Term) 100 Day: 1144.50 Up Trend,
- (Long-Term) 200 Day: 1248.00 Up Trend.
Recent Trade Signals
- 09 Sep 2026: Long ZS 11-26 @ 1311.75 Signals.USAR-MSFG
- 01 Sep 2026: Long ZS 11-26 @ 1299 Signals.USAR-WSFG
Overall Rating
- Short-Term: Bullish,
- Intermediate-Term: Bullish,
- Long-Term: Bullish.
Key Insights Summary
Soybeans completed a sharp weekly upside expansion from the 1150 area and printed a new short-term pivot high near 1317.00. The pivot structure is positive across short and intermediate horizons, while price is above all listed rising benchmarks. The immediate weekly grid is neutral at its F0% area, reflecting a short-term pause zone after the fast rally, but monthly and yearly grids remain in advancing territory. The 1324.00 pivot resistance is the nearest overhead reference, with 1239.50 defining the opposite-pivot reversal level and the 1165.25 to 1122.50 support band marking the broader recovery base.
Chart Analysis ATS AI Generated: 2026-09-09 07:16 for Informational use only, not trading advice. Terms and Risk Disclosure Copyright © 2026. Algo Trading Systems LLC.