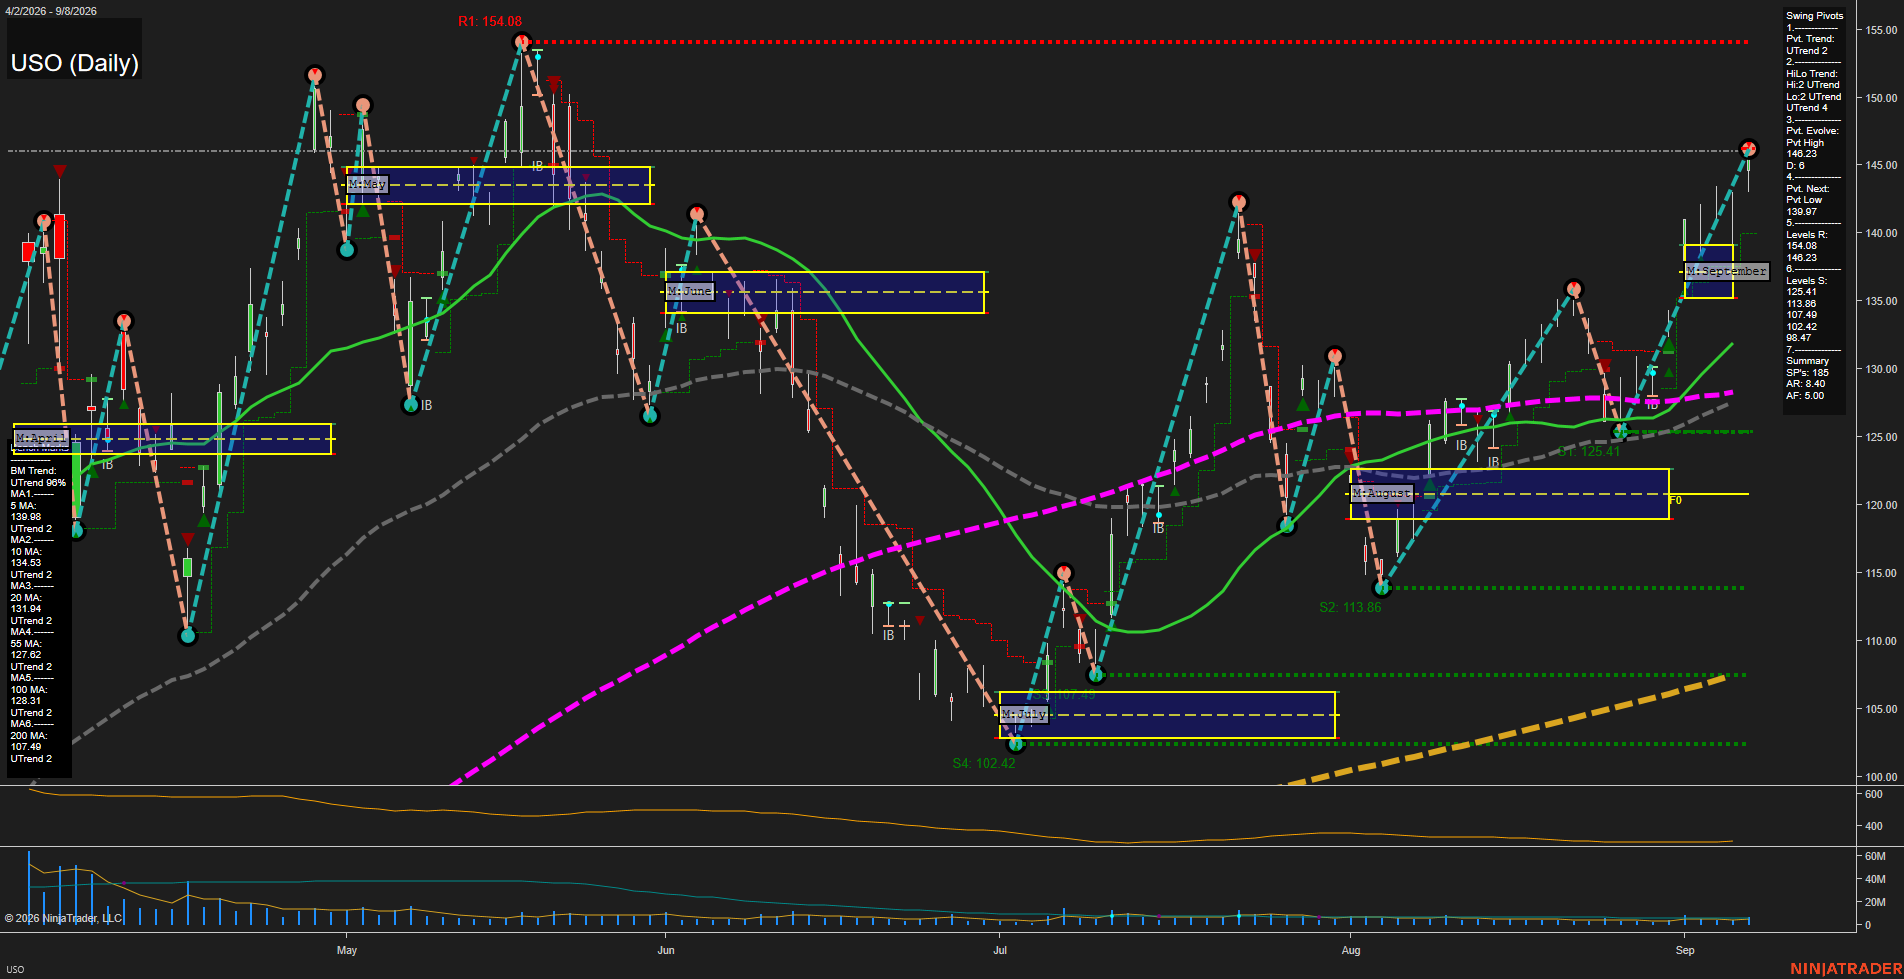
USO United States Oil Fund LP Daily Chart Analysis: 2026-Sep-09 07:13 CT
Price Action
- Last: 145.73,
- Bars: Large,
- Mom: fast.
WSFG Weekly
- Short-Term
- WSFG Current: NA%
- F0%/NTZ' Bias: Price Bullish,
- WSFG Trend: UTrend.
MSFG Month Sep
- Intermediate-Term
- MSFG Current: NA%
- F0%/NTZ' Bias: Price Bullish,
- MSFG Trend: UTrend.
YSFG Year 2026
- Long-Term
- YSFG Current: NA%
- F0%/NTZ' Bias: Price Bullish,
- YSFG Trend: UTrend.
Swing Pivots
- (Short-Term) 1. Pvt. Trend: UTrend,
- (Intermediate-Term) 2. HiLo Trend: UTrend,
- 3. Pvt. Evolve: Pvt high 146.23,
- 4. Pvt. Next: Pvt low 139.97,
- 5. Levels R: 154.08, 146.23,
- 6. Levels S: 125.41, 113.86, 107.49, 102.42, 98.47.
Daily Benchmarks
- (Short-Term) 5 Day: 139.08 Up Trend,
- (Short-Term) 10 Day: 134.53 Up Trend,
- (Intermediate-Term) 20 Day: 131.94 Up Trend,
- (Intermediate-Term) 55 Day: 127.62 Up Trend,
- (Long-Term) 100 Day: 128.31 Up Trend,
- (Long-Term) 200 Day: 107.49 Up Trend.
Additional Metrics
- ATR: 138,
- VOLMA: 2577640.
Overall Rating
- Short-Term: Bullish,
- Intermediate-Term: Bullish,
- Long-Term: Bullish.
Key Insights Summary
USO is in a broad bullish swing structure, with price accelerating above the September monthly grid and holding materially above every benchmark average. The pivot sequence remains higher-high/higher-low, while 146.23 is the active near-term pivot-high reference and 154.08 is the larger overhead resistance. The 139.97 pivot-next level defines the nearby structural retracement threshold; a return toward that area would represent a pullback within the current UTrend rather than a change in the intermediate trend. The separation above the 5-, 10-, and 20-day averages reflects fast upside momentum and expanded daily range behavior, while the rising 55-, 100-, and 200-day averages confirm a bullish multi-timeframe price cycle.
Chart Analysis ATS AI Generated: 2026-09-09 07:13 for Informational use only, not trading advice. Terms and Risk Disclosure Copyright © 2026. Algo Trading Systems LLC.