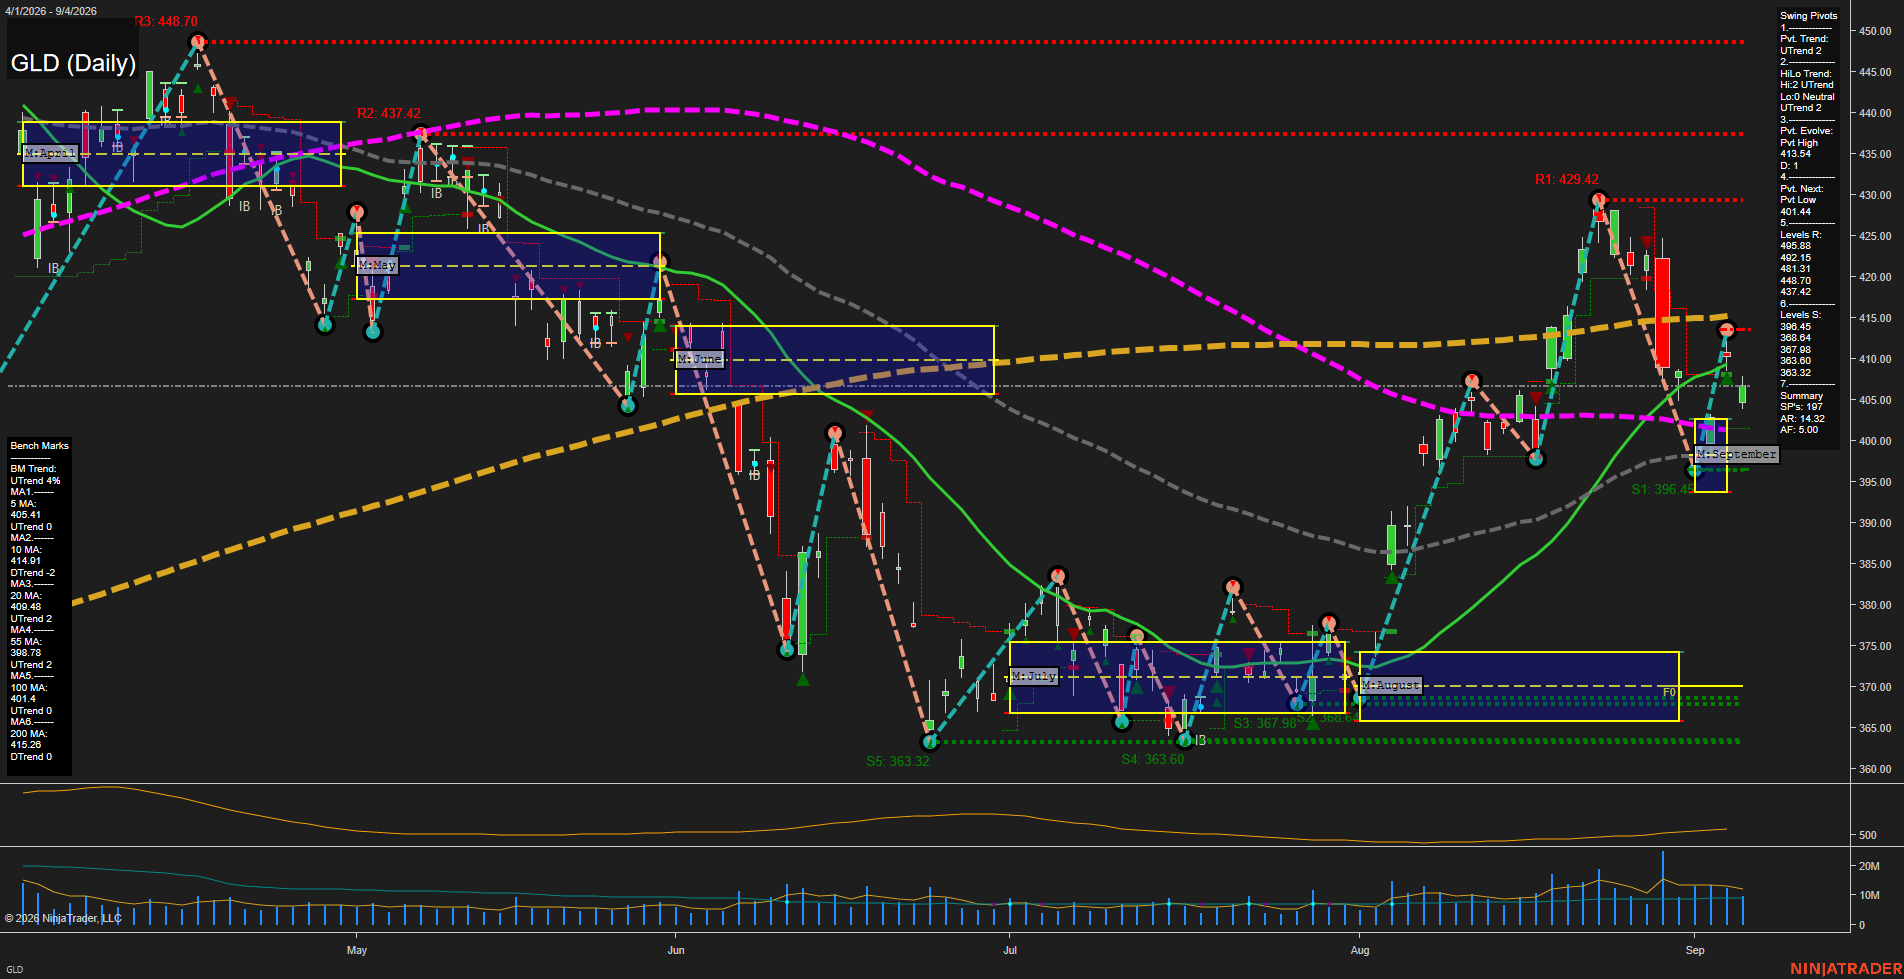
GLD SPDR Gold Shares Daily Chart Analysis: 2026-Sep-08 07:07 CT
Price Action
- Last: 407.98,
- Bars: Medium,
- Mom: Average.
WSFG Weekly
- Short-Term
- WSFG Current: NA%
- F0%/NTZ' Bias: Price Neutral,
- WSFG Trend: Neutral.
MSFG Month Sep
- Intermediate-Term
- MSFG Current: NA%
- F0%/NTZ' Bias: Price Above NTZ,
- MSFG Trend: UTrend.
YSFG Year 2026
- Long-Term
- YSFG Current: NA%
- F0%/NTZ' Bias: Price Neutral,
- YSFG Trend: Neutral.
Swing Pivots
- (Short-Term) 1. Pvt. Trend: UTrend,
- (Intermediate-Term) 2. HiLo Trend: UTrend,
- 3. Pvt. Evolve: Pvt high 413.48,
- 4. Pvt. Next: Pvt low 401.44,
- 5. Levels R: 495.88, 492.15, 481.31, 448.70, 437.42,
- 6. Levels S: 396.45, 368.64, 367.98, 363.60, 363.32.
Daily Benchmarks
- (Short-Term) 5 Day: 405.41 Up Trend,
- (Short-Term) 10 Day: 414.91 Down Trend,
- (Intermediate-Term) 20 Day: 409.82 Up Trend,
- (Intermediate-Term) 55 Day: 398.78 Up Trend,
- (Long-Term) 100 Day: 401.40 Up Trend,
- (Long-Term) 200 Day: 415.26 Down Trend.
Additional Metrics
- ATR: 14.32,
- VOLMA: 11000000.
Overall Rating
- Short-Term: Neutral,
- Intermediate-Term: Bullish,
- Long-Term: Neutral.
Key Insights Summary
GLD, a liquid gold-futures proxy, is consolidating after the sharp August advance, pullback from the 429.42 pivot high, and rebound from the 396.45 support area. The current pivot structure remains upward, while price is holding above the rising 5-day, 55-day, and 100-day benchmarks. Near-term structure is mixed because price remains below the declining 10-day average and below the 413.48 evolving pivot-high area. The 401.44 pivot-next level and 396.45 support define the recent retracement floor, while 413.48 and the 429.42 prior swing high frame the overhead recovery structure. ATR remains elevated, consistent with wider daily gold swings and a still-active post-breakout volatility regime.
Chart Analysis ATS AI Generated: 2026-09-08 07:07 for Informational use only, not trading advice. Terms and Risk Disclosure Copyright © 2026. Algo Trading Systems LLC.