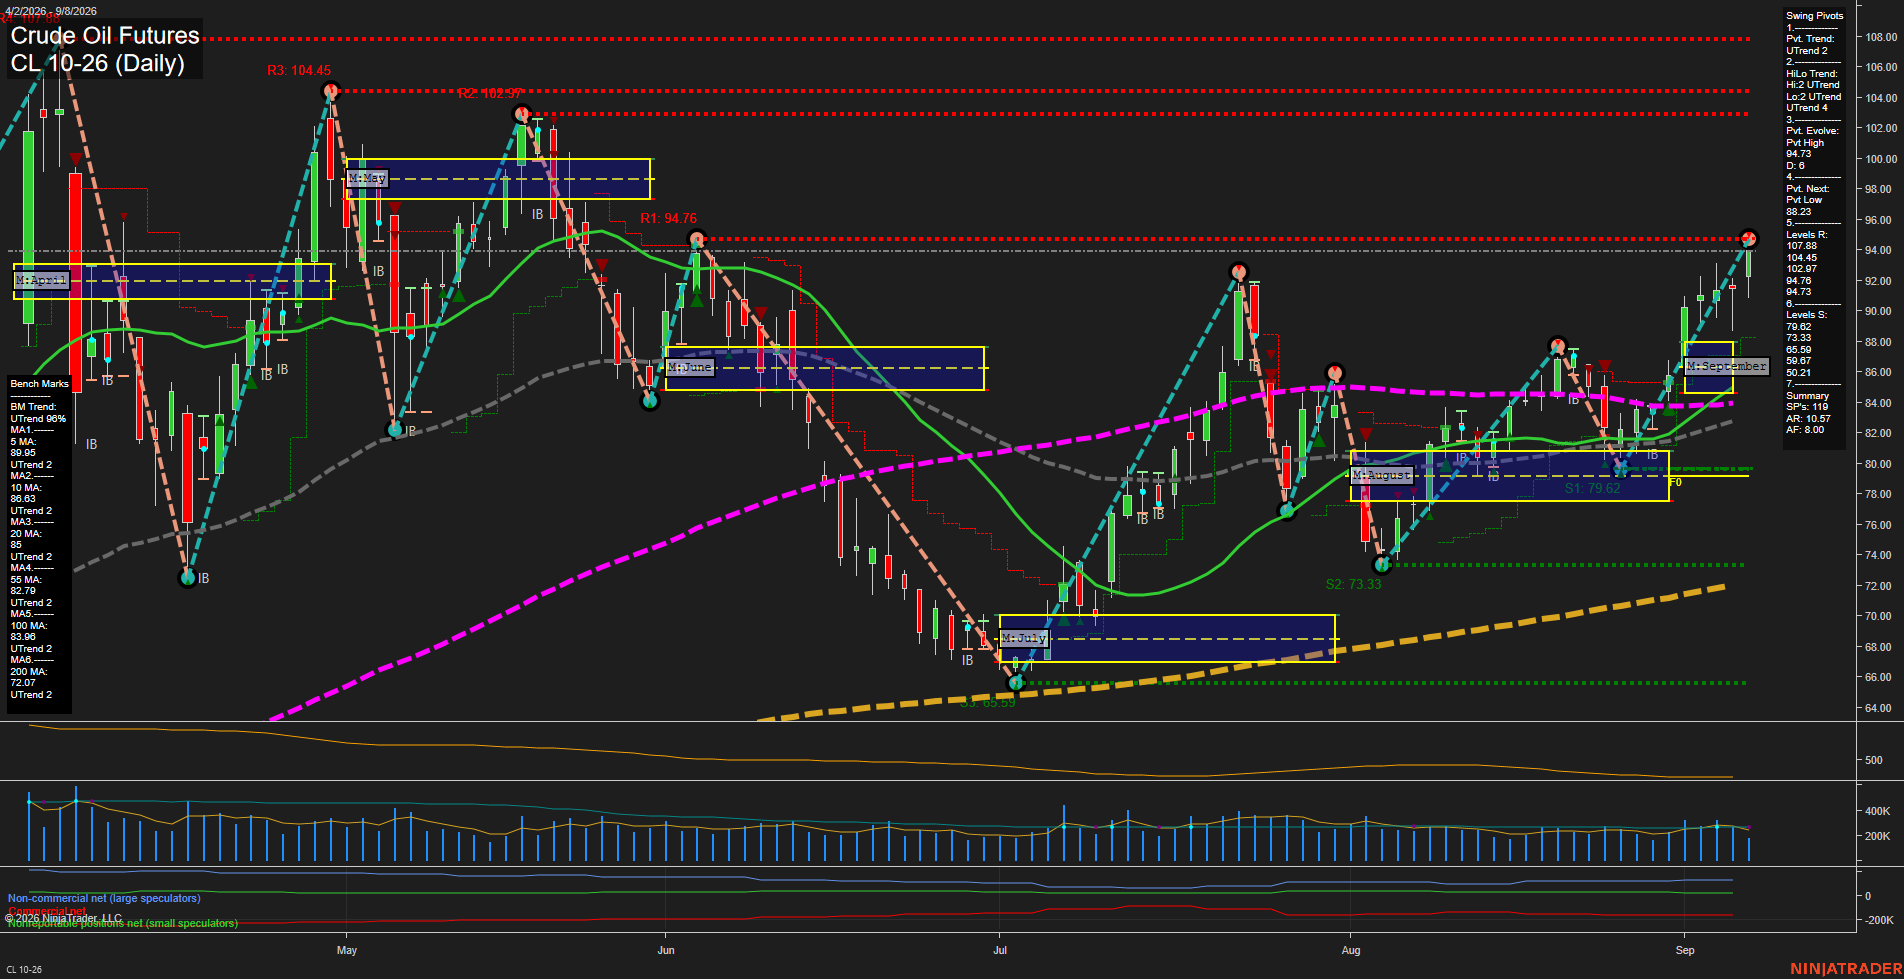
CL Crude Oil Futures Daily Chart Analysis: 2026-Sep-08 07:02 CT
Price Action
- Last: 94.73,
- Bars: Medium,
- Mom: fast.
WSFG Weekly
- Short-Term
- WSFG Current: 19%
- F0%/NTZ' Bias: Price Above,
- WSFG Trend: Up.
MSFG Month Sep
- Intermediate-Term
- MSFG Current: 32%
- F0%/NTZ' Bias: Price Above,
- MSFG Trend: Up.
YSFG Year 2026
- Long-Term
- YSFG Current: 146%
- F0%/NTZ' Bias: Price Above,
- YSFG Trend: Up.
Swing Pivots
- (Short-Term) 1. Pvt. Trend: UTrend,
- (Intermediate-Term) 2. HiLo Trend: UTrend,
- 3. Pvt. Evolve: Pvt high 94.73,
- 4. Pvt. Next: Pvt low 88.23,
- 5. Levels R: 107.88, 104.45, 102.97, 94.76, 94.73,
- 6. Levels S: 79.62, 73.33, 65.59.
Daily Benchmarks
- (Short-Term) 5 Day: 89.96 Up Trend,
- (Short-Term) 10 Day: 86.63 Up Trend,
- (Intermediate-Term) 20 Day: 85.00 Up Trend,
- (Intermediate-Term) 55 Day: 82.79 Up Trend,
- (Long-Term) 100 Day: 83.99 Up Trend,
- (Long-Term) 200 Day: 72.07 Up Trend.
Additional Metrics
Recent Trade Signals
- 08 Sep 2026: Long CL 10-26 @ 93.93 Signals.USAR-WSFG
- 04 Sep 2026: Long CL 10-26 @ 91.11 Signals.USAR-MSFG
Overall Rating
- Short-Term: Bullish,
- Intermediate-Term: Bullish,
- Long-Term: Bullish.
Key Insights Summary
Price is advancing in a fast upside swing, holding above every benchmark moving average and maintaining aligned upward short-, intermediate-, and long-term trend structure. The recovery from the August pivot low produced higher lows and a breakout through the September grid area, bringing price into the 94.73 to 94.76 pivot-resistance zone. The active pivot remains a high, while 88.23 defines the opposite-pivot reversal level; broader support is layered at 79.62, 73.33, and 65.59. The next higher resistance sequence is 102.97, 104.45, and 107.88, reflecting substantial overhead room if the current expansion continues.
Chart Analysis ATS AI Generated: 2026-09-08 07:03 for Informational use only, not trading advice. Terms and Risk Disclosure Copyright © 2026. Algo Trading Systems LLC.