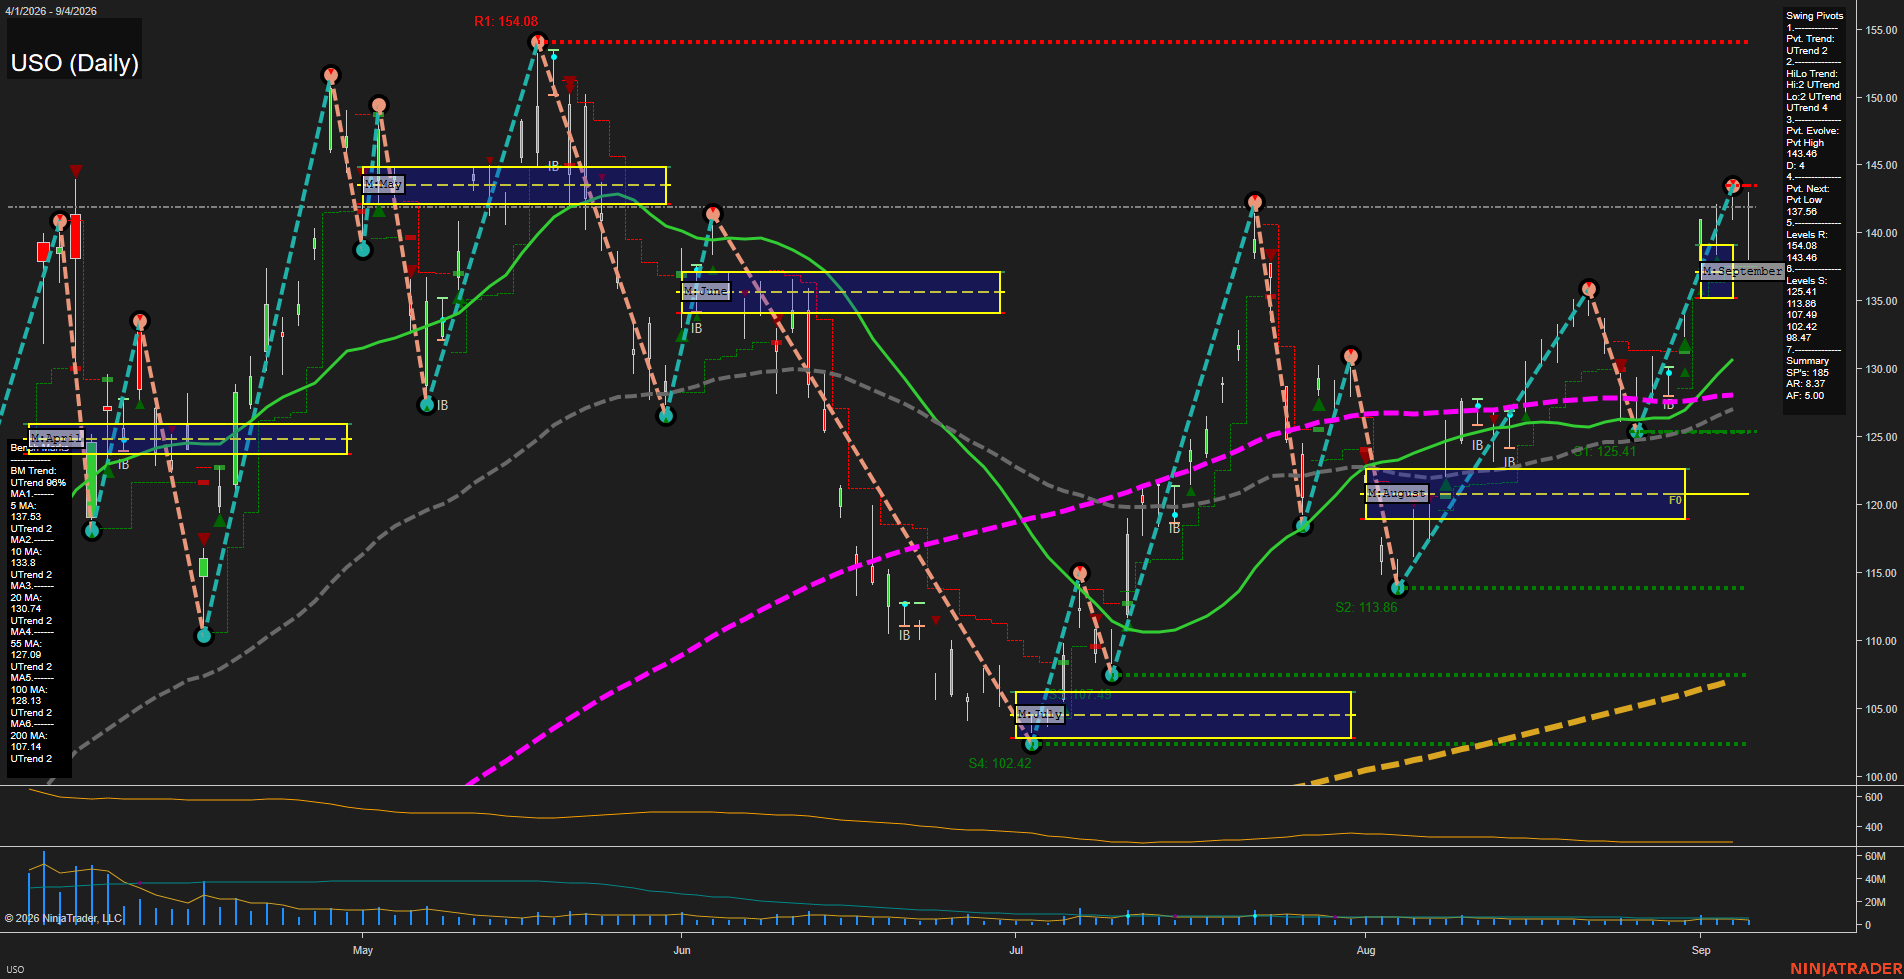
USO United States Oil Fund LP Daily Chart Analysis: 2026-Sep-07 07:13 CT
Price Action
- Last: 143.48,
- Bars: Large,
- Mom: fast.
WSFG Weekly
- Short-Term
- WSFG Current: NA%
- F0%/NTZ' Bias: Price Neutral,
- WSFG Trend: Neutral.
MSFG Month Sep
- Intermediate-Term
- MSFG Current: NA%
- F0%/NTZ' Bias: Price Bullish,
- MSFG Trend: UTrend.
YSFG Year 2026
- Long-Term
- YSFG Current: NA%
- F0%/NTZ' Bias: Price Neutral,
- YSFG Trend: Neutral.
Swing Pivots
- (Short-Term) 1. Pvt. Trend: UTrend,
- (Intermediate-Term) 2. HiLo Trend: UTrend,
- 3. Pvt. Evolve: Pvt high 143.48,
- 4. Pvt. Next: Pvt low 137.58,
- 5. Levels R: 154.08, 143.48,
- 6. Levels S: 125.41, 113.86, 107.49, 102.42, 98.47, 79.77.
Daily Benchmarks
- (Short-Term) 5 Day: 137.53 Up Trend,
- (Short-Term) 10 Day: 133.80 Up Trend,
- (Intermediate-Term) 20 Day: 130.74 Up Trend,
- (Intermediate-Term) 55 Day: 127.09 Up Trend,
- (Long-Term) 100 Day: 128.13 Up Trend,
- (Long-Term) 200 Day: 107.14 Up Trend.
Additional Metrics
- ATR: 138,
- VOLMA: 2577640.
Overall Rating
- Short-Term: Bullish,
- Intermediate-Term: Bullish,
- Long-Term: Bullish.
Key Insights Summary
USO is in a broad daily-chart recovery sequence, with price extending sharply above all six rising benchmark averages and printing a new short-term pivot high at 143.48. The pivot structure is aligned upward across both short- and intermediate-term measures, while 137.58 defines the next opposite-pivot level beneath the current advance. The September monthly grid has been exceeded on the upside, reflecting strong directional expansion after the August consolidation. The move is fast and extended relative to the 5-day average, with 154.08 the next major overhead swing resistance and 125.41 the principal lower structural support.
Chart Analysis ATS AI Generated: 2026-09-07 07:14 for Informational use only, not trading advice. Terms and Risk Disclosure Copyright © 2026. Algo Trading Systems LLC.