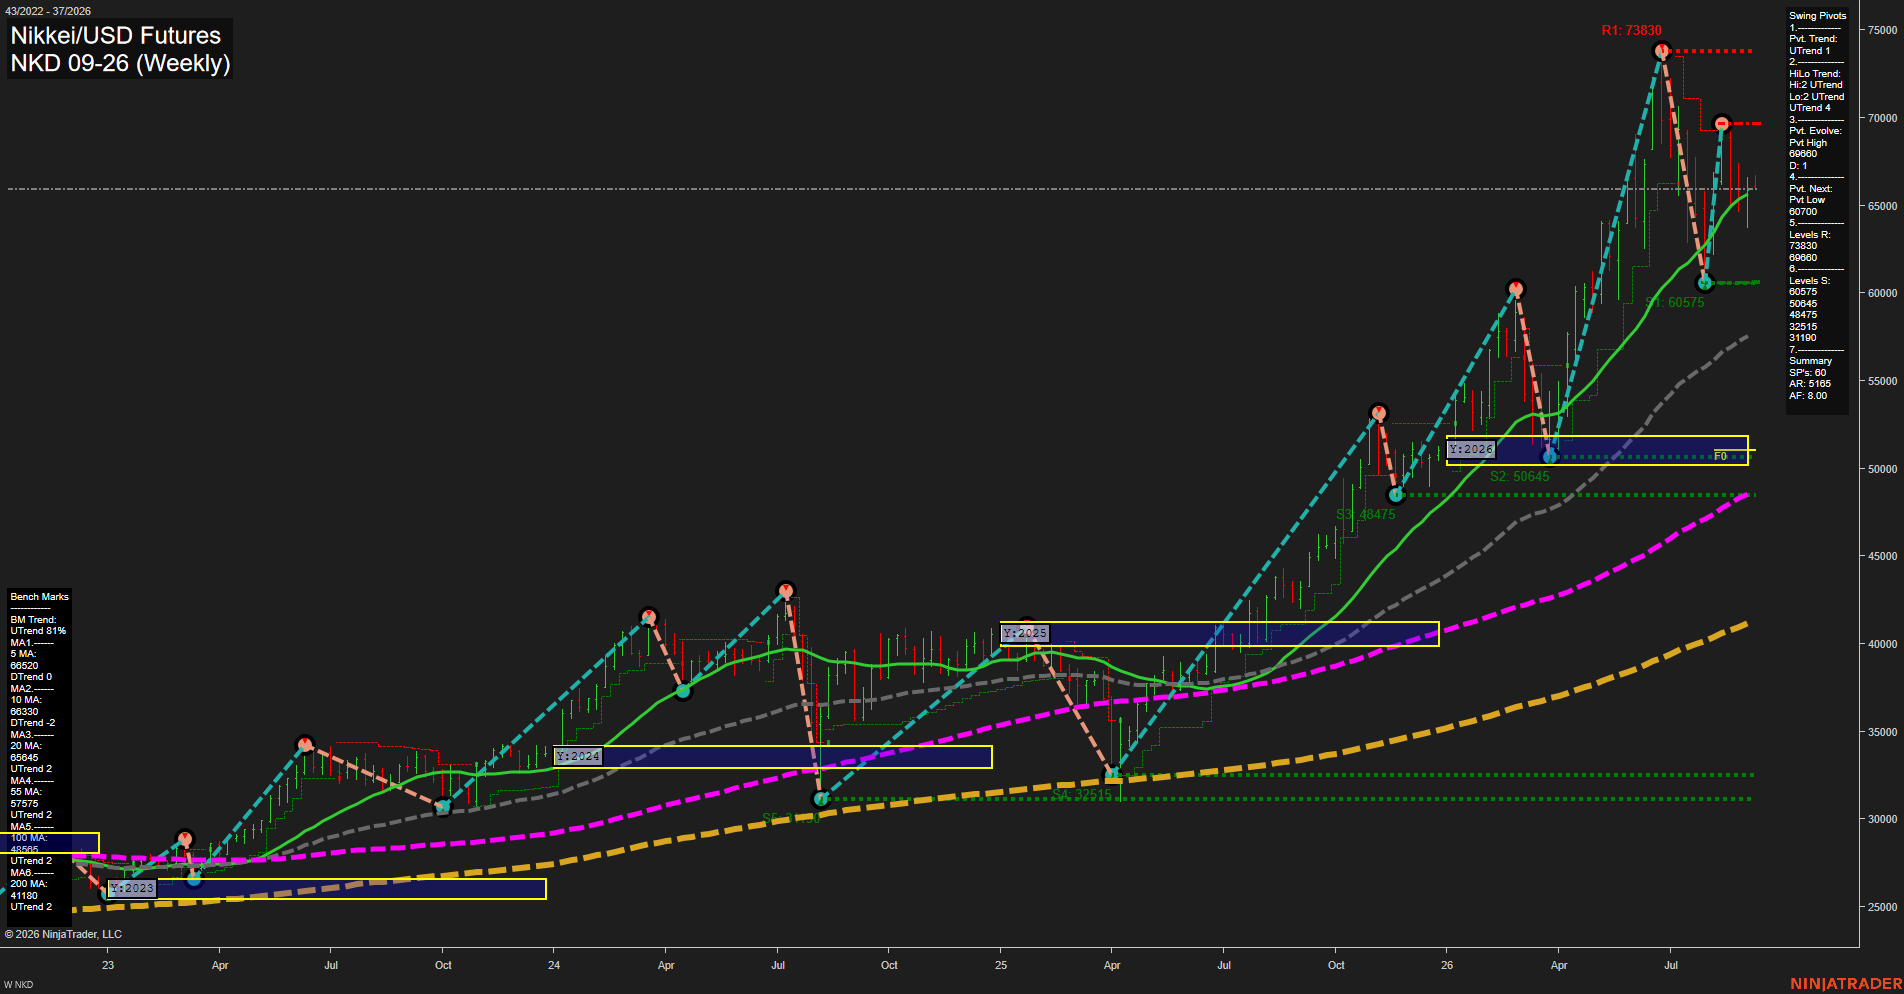
NKD Nikkei/USD Futures Weekly Chart Analysis: 2026-Sep-07 07:09 CT
Price Action
- Last: 65645,
- Bars: Medium,
- Mom: Fast.
WSFG Weekly
- Short-Term
- WSFG Current: -2%
- F0%/NTZ' Bias: Price Below,
- WSFG Trend: Down.
MSFG Month Sep
- Intermediate-Term
- MSFG Current: -3%
- F0%/NTZ' Bias: Price Below,
- MSFG Trend: Down.
YSFG Year 2026
- Long-Term
- YSFG Current: 180%
- F0%/NTZ' Bias: Price Above,
- YSFG Trend: Up.
Swing Pivots
- (Short-Term) 1. Pvt. Trend: UTrend,
- (Intermediate-Term) 2. HiLo Trend: UTrend,
- 3. Pvt. Evolve: Pvt high 69660,
- 4. Pvt. Next: Pvt low 60700,
- 5. Levels R: 73830, 69660,
- 6. Levels S: 60755, 50645, 48475, 32515, 31190.
Weekly Benchmarks
- (Short-Term) 5 Day: 65645 Up Trend,
- (Short-Term) 10 Day: 66330 Down Trend,
- (Intermediate-Term) 20 Day: 65645 Up Trend,
- (Intermediate-Term) 55 Day: 57575 Up Trend,
- (Long-Term) 100 Day: 48585 Up Trend,
- (Long-Term) 200 Day: 41180 Up Trend.
Recent Trade Signals
- 07 Sep 2026: Long NKD 09-26 @ 66480 Signals.USAR-WSFG
- 04 Sep 2026: Long NKD 09-26 @ 65050 Signals.USAR.TR120
- 03 Sep 2026: Short NKD 09-26 @ 64280 Signals.USAR-MSFG
Overall Rating
- Short-Term: Bullish,
- Intermediate-Term: Neutral,
- Long-Term: Bullish.
Key Insights Summary
NKD retains a bullish primary swing structure, with both pivot trends rising and price substantially above the yearly F0%/NTZ framework and all major 55-, 100-, and 200-period benchmarks. The recent recovery from the 60755 pivot low has restored fast upside momentum, although price is consolidating around the rising 20-period benchmark and remains below the 10-period average. The short-term weekly and monthly Fib grids remain negative, describing a countertrend retracement within the larger advance. The 69660 pivot high is the immediate overhead swing reference, followed by 73830, while 60755 remains the dominant nearby structural support.
Chart Analysis ATS AI Generated: 2026-09-07 07:09 for Informational use only, not trading advice. Terms and Risk Disclosure Copyright © 2026. Algo Trading Systems LLC.