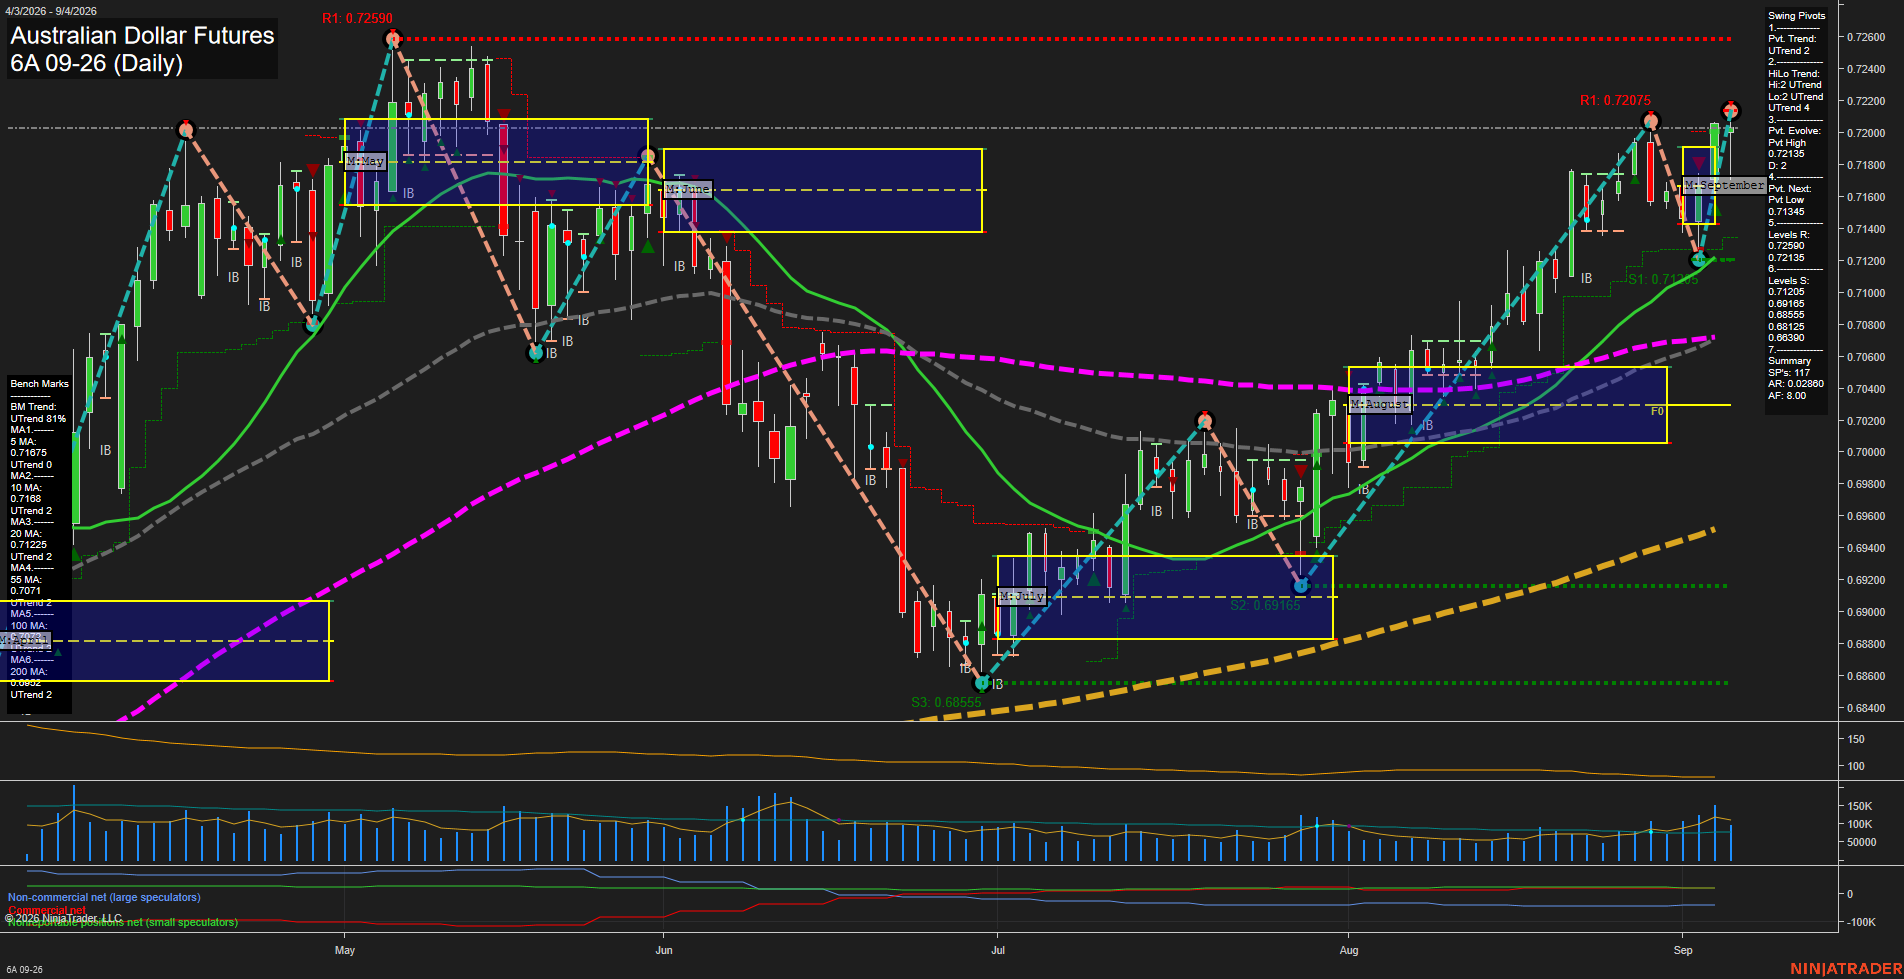
6A Australian Dollar Futures Daily Chart Analysis: 2026-Sep-07 07:00 CT
Price Action
- Last: 0.7218,
- Bars: Medium,
- Mom: fast.
WSFG Weekly
- Short-Term
- WSFG Current: NA%
- F0%/NTZ' Bias: Price Bullish,
- WSFG Trend: UTrend.
MSFG Month Sep
- Intermediate-Term
- MSFG Current: NA%
- F0%/NTZ' Bias: Price Bullish,
- MSFG Trend: UTrend.
YSFG Year 2026
- Long-Term
- YSFG Current: NA%
- F0%/NTZ' Bias: Price Bullish,
- YSFG Trend: UTrend.
Swing Pivots
- (Short-Term) 1. Pvt. Trend: UTrend,
- (Intermediate-Term) 2. HiLo Trend: UTrend,
- 3. Pvt. Evolve: Pvt high 0.7218,
- 4. Pvt. Next: Pvt low 0.71345,
- 5. Levels R: 0.72590, 0.72135,
- 6. Levels S: 0.71205, 0.69165, 0.68555, 0.68125, 0.66390.
Daily Benchmarks
- (Short-Term) 5 Day: 0.71675 Up Trend,
- (Short-Term) 10 Day: 0.7168 Up Trend,
- (Intermediate-Term) 20 Day: 0.71225 Up Trend,
- (Intermediate-Term) 55 Day: 0.7071 Up Trend,
- (Long-Term) 100 Day: 0.7033 Up Trend,
- (Long-Term) 200 Day: 0.6922 Up Trend.
Additional Metrics
Recent Trade Signals
- 07 Sep 2026: Long 6A 09-26 @ 0.7218 Signals.USAR-WSFG
- 07 Sep 2026: Long 6A 09-26 @ 0.7208 Signals.USAR-MSFG
- 02 Sep 2026: Long 6A 09-26 @ 0.71675 Signals.USAR.TR120
Overall Rating
- Short-Term: Bullish,
- Intermediate-Term: Bullish,
- Long-Term: Bullish.
Key Insights Summary
The daily swing structure is broadly bullish: price has advanced above all six rising benchmark averages, the short-term pivot trend and intermediate HiLo trend are both UTrend, and the September monthly grid has been exceeded on the upside. The recent pullback formed a higher low near 0.71205 before a sharp recovery back through 0.7200. Price is now pressing the 0.72135 pivot area and is approaching the primary 0.72590 resistance, leaving the market extended relative to the 5-day and 10-day averages. Volume has improved during the late-August to early-September advance, while ATR remains moderate, consistent with an orderly directional swing rather than a disorderly volatility expansion. The 0.71345 pivot-next level and 0.71205 support define the nearest structural pullback zone; a sustained hold above that area preserves the higher-low sequence.
Chart Analysis ATS AI Generated: 2026-09-07 07:00 for Informational use only, not trading advice. Terms and Risk Disclosure Copyright © 2026. Algo Trading Systems LLC.