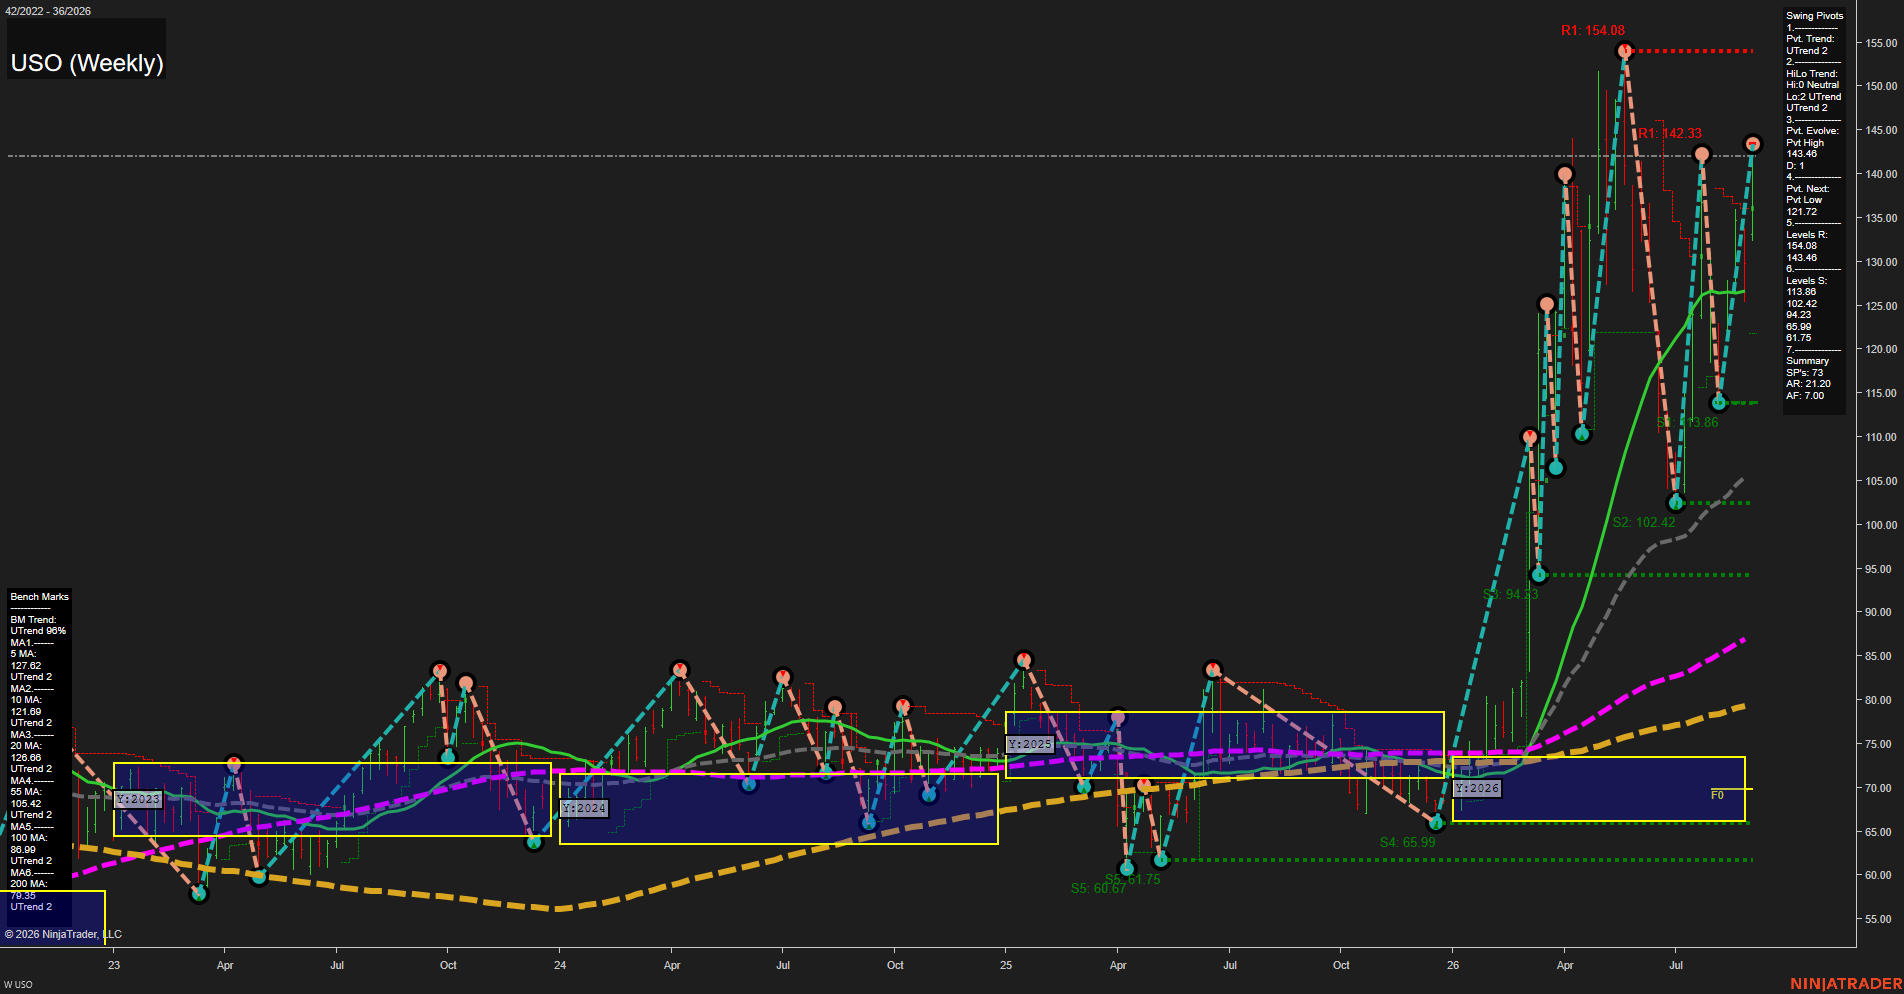
USO United States Oil Fund LP Weekly Chart Analysis: 2026-Sep-04 07:13 CT
Price Action
- Last: 143.48,
- Bars: Large,
- Mom: fast.
WSFG Weekly
- Short-Term
- WSFG Current: NA%
- F0%/NTZ' Bias: Price Above NTZ,
- WSFG Trend: UTrend.
MSFG Month Sep
- Intermediate-Term
- MSFG Current: NA%
- F0%/NTZ' Bias: Price Above NTZ,
- MSFG Trend: UTrend.
YSFG Year 2026
- Long-Term
- YSFG Current: NA%
- F0%/NTZ' Bias: Price Above NTZ,
- YSFG Trend: UTrend.
Swing Pivots
- (Short-Term) 1. Pvt. Trend: UTrend,
- (Intermediate-Term) 2. HiLo Trend: UTrend,
- 3. Pvt. Evolve: Pvt high 143.48,
- 4. Pvt. Next: Pvt low 121.72,
- 5. Levels R: 154.08, 143.48,
- 6. Levels S: 113.86, 102.42, 94.23, 65.99, 61.75.
Weekly Benchmarks
- (Short-Term) 5 Day: 127.62 Up Trend,
- (Short-Term) 10 Day: 121.89 Up Trend,
- (Intermediate-Term) 20 Day: 126.60 Up Trend,
- (Intermediate-Term) 55 Day: 105.42 Up Trend,
- (Long-Term) 100 Day: 86.99 Up Trend,
- (Long-Term) 200 Day: 78.37 Up Trend.
Overall Rating
- Short-Term: Bullish,
- Intermediate-Term: Bullish,
- Long-Term: Bullish.
Key Insights Summary
USO reflects a high-volatility, futures-style upside expansion: price is well above the yearly NTZ and every weekly benchmark is rising. The pivot structure remains in a short-term UTrend and intermediate-term UTrend, with the recovery advancing back into the 143.48 pivot-high area beneath major 154.08 resistance. Large weekly bars and fast momentum characterize an impulsive rally rather than a low-volatility consolidation; 121.72 is the next pivot reversal reference, followed by layered supports at 113.86 and 102.42.
Chart Analysis ATS AI Generated: 2026-09-04 07:13 for Informational use only, not trading advice. Terms and Risk Disclosure Copyright © 2026. Algo Trading Systems LLC.