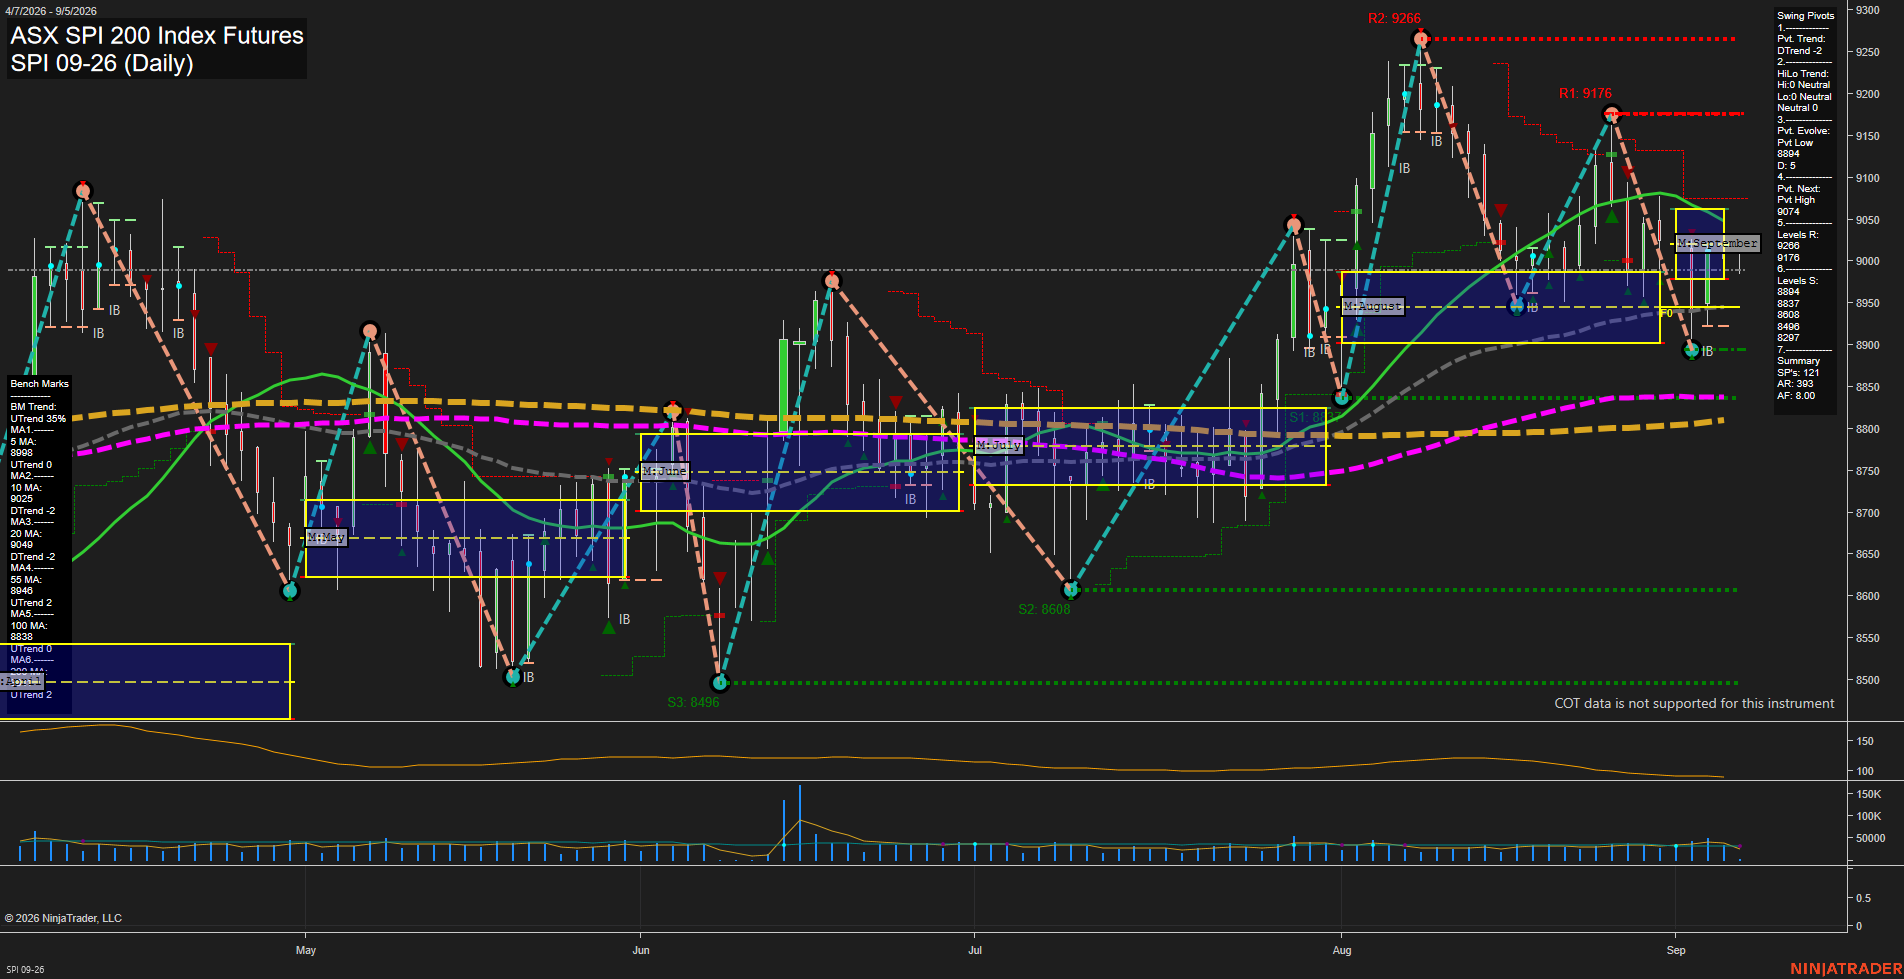
SPI ASX SPI 200 Index Futures Daily Chart Analysis: 2026-Sep-04 07:11 CT
Price Action
- Last: 8997,
- Bars: Large,
- Mom: fast.
WSFG Weekly
- Short-Term
- WSFG Current: NA%
- F0%/NTZ' Bias: Price Neutral,
- WSFG Trend: Neutral.
MSFG Month Sep
- Intermediate-Term
- MSFG Current: NA%
- F0%/NTZ' Bias: Price Neutral,
- MSFG Trend: Neutral.
YSFG Year 2026
- Long-Term
- YSFG Current: NA%
- F0%/NTZ' Bias: Price Neutral,
- YSFG Trend: Neutral.
Swing Pivots
- (Short-Term) 1. Pvt. Trend: DTrend,
- (Intermediate-Term) 2. HiLo Trend: DTrend,
- 3. Pvt. Evolve: Pvt low 8894,
- 4. Pvt. Next: Pvt high 9074,
- 5. Levels R: 9176, 9074,
- 6. Levels S: 8894, 8837, 8808, 8496, 8297.
Daily Benchmarks
- (Short-Term) 5 Day: 8989 Up Trend,
- (Short-Term) 10 Day: 9025 Down Trend,
- (Intermediate-Term) 20 Day: 9048 Down Trend,
- (Intermediate-Term) 55 Day: 8946 Up Trend,
- (Long-Term) 100 Day: 8838 Up Trend,
- (Long-Term) 200 Day: 8793 Up Trend.
Additional Metrics
Overall Rating
- Short-Term: Bearish,
- Intermediate-Term: Neutral,
- Long-Term: Bullish.
Key Insights Summary
SPI futures produced a sharp rebound from the 8894 swing-low support area, returning above the rising 5-day and 55-day benchmarks. The short-term pivot structure remains bearish, however, with price still beneath the falling 10-day and 20-day averages and with 9074 acting as the next pivotal overhead level. Intermediate structure is mixed and range-like within the September monthly grid, while the longer-term backdrop remains constructive above the rising 100-day and 200-day averages. The recent decline from 9176 to 8894 and subsequent fast recovery reflects elevated daily volatility, with 8894 and 8837 defining important downside structure and 9074 then 9176 defining the primary upside swing boundaries.
Chart Analysis ATS AI Generated: 2026-09-04 07:12 for Informational use only, not trading advice. Terms and Risk Disclosure Copyright © 2026. Algo Trading Systems LLC.