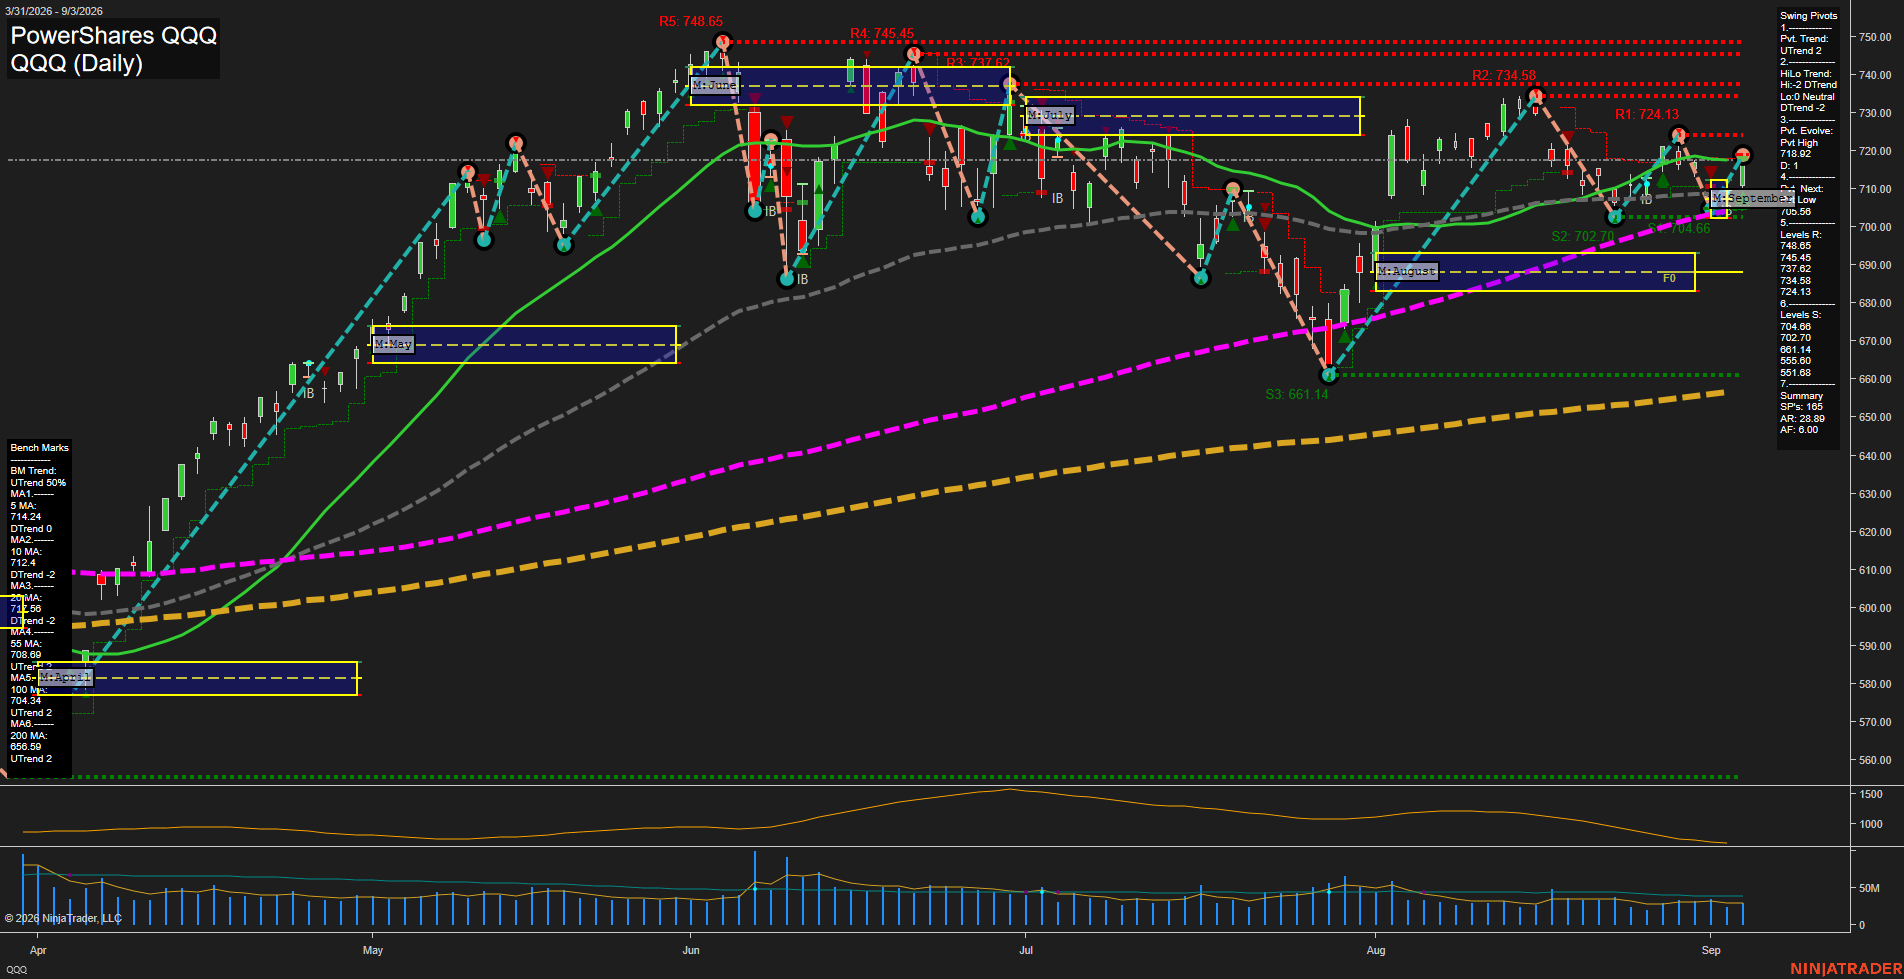
QQQ PowerShares QQQ Daily Chart Analysis: 2026-Sep-04 07:09 CT
Price Action
- Last: 719.92,
- Bars: Small,
- Mom: Slow.
WSFG Weekly
- Short-Term
- WSFG Current: NA%
- F0%/NTZ' Bias: Price Neutral,
- WSFG Trend: Neutral.
MSFG Month Sep
- Intermediate-Term
- MSFG Current: NA%
- F0%/NTZ' Bias: Price Bullish,
- MSFG Trend: Bullish.
YSFG Year 2026
- Long-Term
- YSFG Current: NA%
- F0%/NTZ' Bias: Price Neutral,
- YSFG Trend: Neutral.
Swing Pivots
- (Short-Term) 1. Pvt. Trend: UTrend,
- (Intermediate-Term) 2. HiLo Trend: DTrend,
- 3. Pvt. Evolve: Pvt high 718.02,
- 4. Pvt. Next: Pvt low 705.86,
- 5. Levels R: 748.65, 745.45, 737.62, 734.58, 724.13,
- 6. Levels S: 704.66, 702.70, 661.14, 655.60, 551.68.
Daily Benchmarks
- (Short-Term) 5 Day: 714.24 Up Trend,
- (Short-Term) 10 Day: 712.40 Down Trend,
- (Intermediate-Term) 20 Day: 717.56 Down Trend,
- (Intermediate-Term) 55 Day: 708.69 Up Trend,
- (Long-Term) 100 Day: 704.34 Up Trend,
- (Long-Term) 200 Day: 656.59 Up Trend.
Additional Metrics
- ATR: 28.89,
- VOLMA: 32709273.
Overall Rating
- Short-Term: Neutral,
- Intermediate-Term: Neutral,
- Long-Term: Bullish.
Key Insights Summary
QQQ is consolidating near 720 after recovering from the late-July washout, with small daily bars and slowing momentum indicating a compressed, rotational futures-style environment. The short-term pivot structure remains upward, but the intermediate HiLo trend remains downward and price is testing the 724.13 pivot resistance area. September MSFG positioning is constructive above the NTZ region, while the 55-, 100-, and 200-day benchmarks maintain a positive broader trend structure. The 705.86 pivot-next level and clustered 704.66 to 702.70 supports define the nearby retracement zone; a sustained move through 724.13 would place the 734.58 to 737.62 resistance band back into focus.
Chart Analysis ATS AI Generated: 2026-09-04 07:10 for Informational use only, not trading advice. Terms and Risk Disclosure Copyright © 2026. Algo Trading Systems LLC.