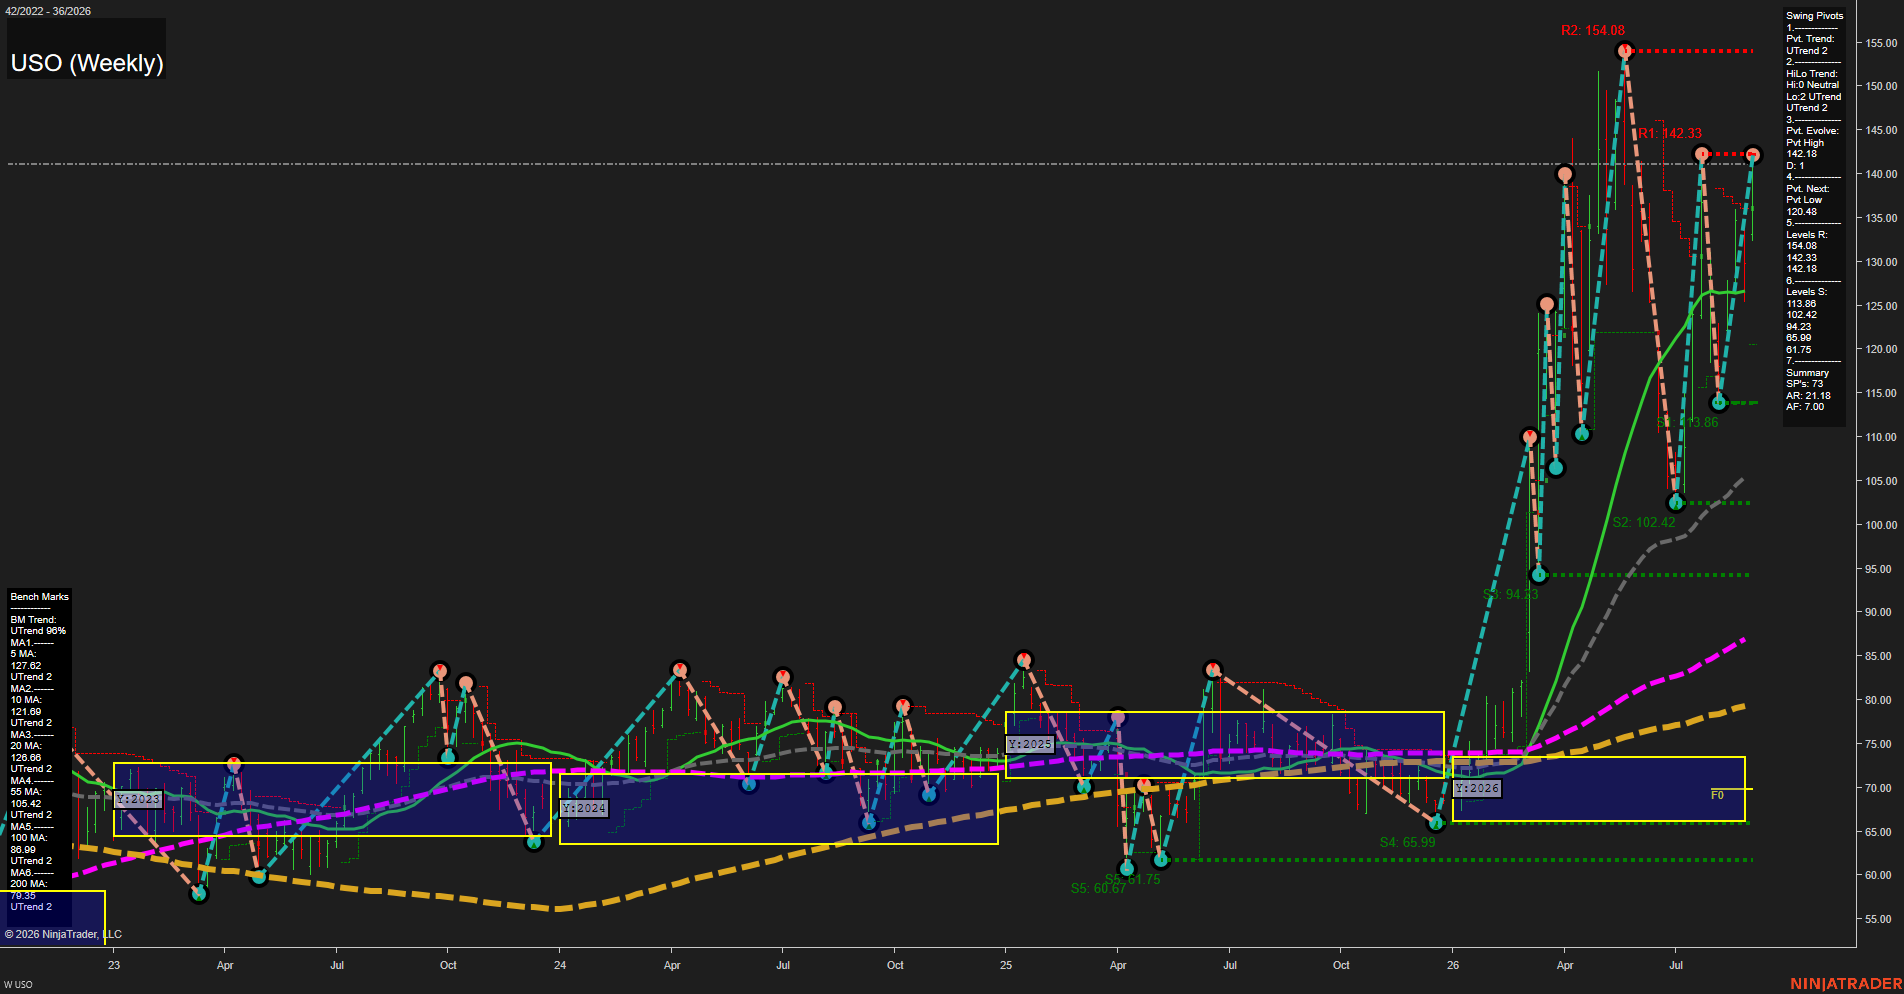
USO United States Oil Fund LP Weekly Chart Analysis: 2026-Sep-03 07:12 CT
Price Action
- Last: 141.80,
- Bars: Large,
- Mom: fast.
WSFG Weekly
- Short-Term
- WSFG Current: NA%
- F0%/NTZ' Bias: Price Neutral,
- WSFG Trend: Neutral.
MSFG Month Sep
- Intermediate-Term
- MSFG Current: NA%
- F0%/NTZ' Bias: Price Neutral,
- MSFG Trend: Neutral.
YSFG Year 2026
- Long-Term
- YSFG Current: NA%
- F0%/NTZ' Bias: Price Above NTZ,
- YSFG Trend: UTrend.
Swing Pivots
- (Short-Term) 1. Pvt. Trend: UTrend,
- (Intermediate-Term) 2. HiLo Trend: UTrend,
- 3. Pvt. Evolve: Pvt high 142.18,
- 4. Pvt. Next: Pvt low 120.48,
- 5. Levels R: 154.08, 142.33, 142.18,
- 6. Levels S: 113.86, 102.42, 94.23, 65.99, 61.75.
Weekly Benchmarks
- (Short-Term) 5 Day: 127.62 Up Trend,
- (Short-Term) 10 Day: 121.69 Up Trend,
- (Intermediate-Term) 20 Day: 126.66 Up Trend,
- (Intermediate-Term) 55 Day: 105.42 Up Trend,
- (Long-Term) 100 Day: 86.99 Up Trend,
- (Long-Term) 200 Day: 78.37 Up Trend.
Overall Rating
- Short-Term: Bullish,
- Intermediate-Term: Bullish,
- Long-Term: Bullish.
Key Insights Summary
USO is in a high-volatility weekly expansion phase, with price holding near the 142.18 pivot-high area after a sharp V-shaped recovery from the July 113.86 swing low. The pivot structure is positive across short and intermediate horizons, while price remains materially above every benchmark average and the 2026 yearly NTZ. The 142.18-142.33 area is the immediate overhead pivot band, followed by 154.08; 120.48 is the next pivot-reversal threshold, with 113.86 defining the larger weekly support shelf. The broad moving-average separation confirms a powerful long-term trend acceleration, although the large weekly bars show an elevated, news-sensitive crude-oil volatility regime.
Chart Analysis ATS AI Generated: 2026-09-03 07:13 for Informational use only, not trading advice. Terms and Risk Disclosure Copyright © 2026. Algo Trading Systems LLC.