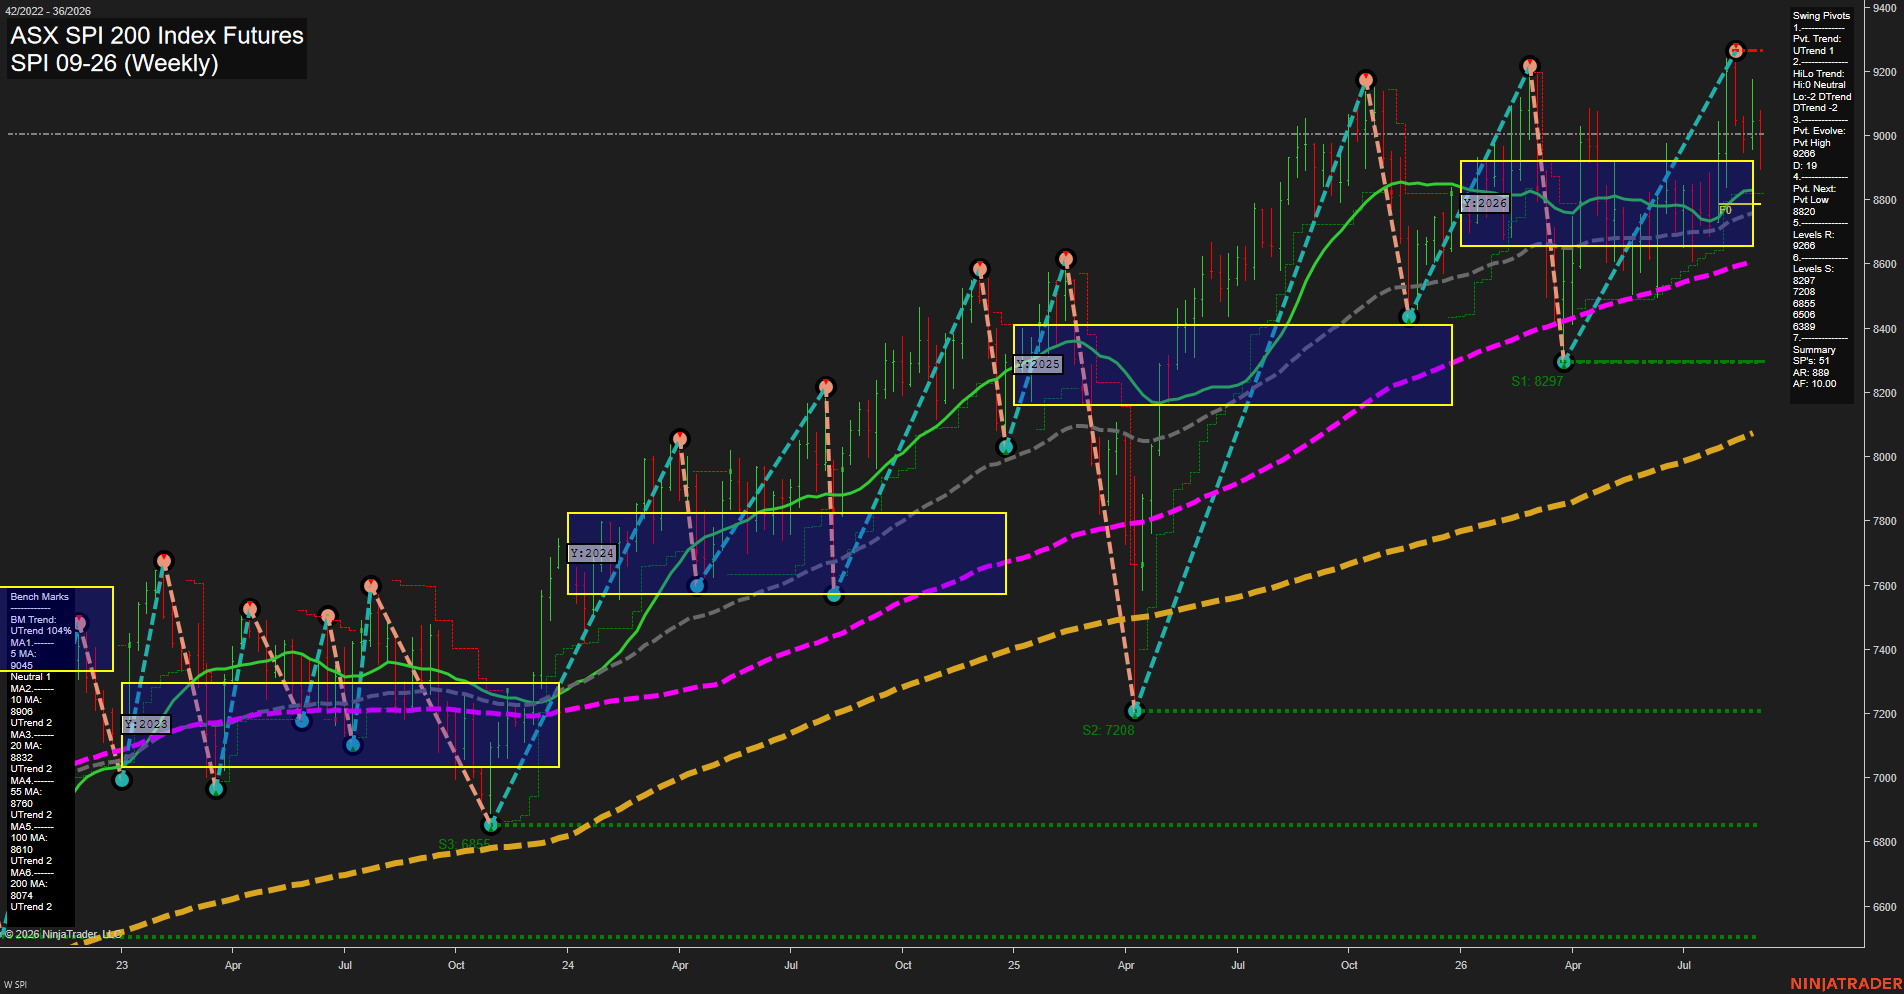
SPI ASX SPI 200 Index Futures Weekly Chart Analysis: 2026-Sep-03 07:11 CT
Price Action
- Last: 9000,
- Bars: Medium,
- Mom: average.
WSFG Weekly
- Short-Term
- WSFG Current: NA%
- F0%/NTZ' Bias: Price Neutral,
- WSFG Trend: Neutral.
MSFG Month Sep
- Intermediate-Term
- MSFG Current: NA%
- F0%/NTZ' Bias: Price Neutral,
- MSFG Trend: Neutral.
YSFG Year 2026
- Long-Term
- YSFG Current: NA%
- F0%/NTZ' Bias: Price Bullish,
- YSFG Trend: Bullish.
Swing Pivots
- (Short-Term) 1. Pvt. Trend: UTrend,
- (Intermediate-Term) 2. HiLo Trend: DTrend,
- 3. Pvt. Evolve: Pvt high 9266,
- 4. Pvt. Next: Pvt low 8820,
- 5. Levels R: 9266,
- 6. Levels S: 8297, 7208, 6855, 6339.
Weekly Benchmarks
- (Short-Term) 5 Day: 9045 Neutral,
- (Short-Term) 10 Day: 8908 Up Trend,
- (Intermediate-Term) 20 Day: 8832 Up Trend,
- (Intermediate-Term) 55 Day: 8760 Up Trend,
- (Long-Term) 100 Day: 8610 Up Trend,
- (Long-Term) 200 Day: 8074 Up Trend.
Overall Rating
- Short-Term: Bullish,
- Intermediate-Term: Bullish,
- Long-Term: Bullish.
Key Insights Summary
SPI remains in a broad weekly advance, with price holding above the rising 10, 20, 55, 100 and 200-period benchmarks. The immediate swing structure is an UTrend, although the market is consolidating beneath the 9266 pivot-high resistance after a rejection from the recent high. The 9000 area is a near-term balance zone; 8820 is the pivot reversal reference, while 8297 is the more significant lower swing support. The intermediate HiLo structure remains less decisive following recent volatility, but the rising benchmark alignment and price position above the 2026 yearly NTZ support the prevailing long-term bullish trend.
Chart Analysis ATS AI Generated: 2026-09-03 07:11 for Informational use only, not trading advice. Terms and Risk Disclosure Copyright © 2026. Algo Trading Systems LLC.