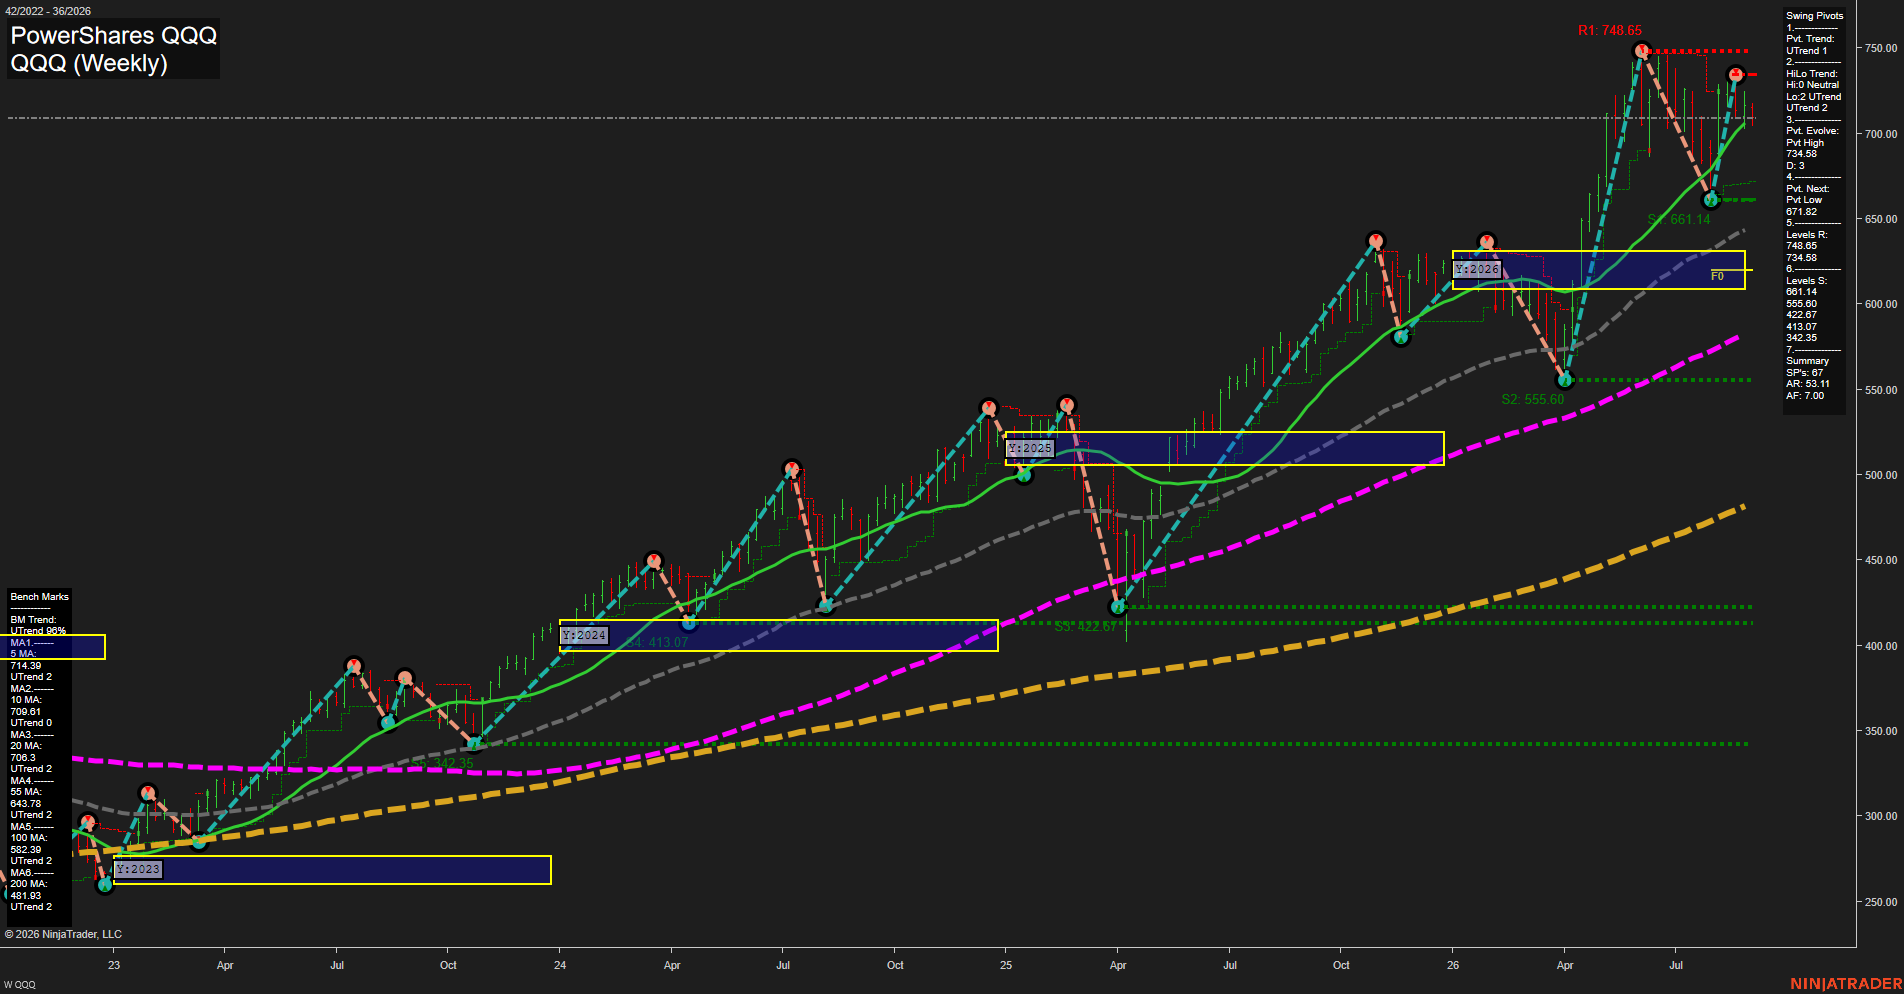
QQQ PowerShares QQQ Weekly Chart Analysis: 2026-Sep-03 07:09 CT
Price Action
- Last: 716.09,
- Bars: Large,
- Mom: fast.
WSFG Weekly
- Short-Term
- WSFG Current: NA%
- F0%/NTZ' Bias: Price Bullish,
- WSFG Trend: Bullish.
MSFG Month Sep
- Intermediate-Term
- MSFG Current: NA%
- F0%/NTZ' Bias: Price Bullish,
- MSFG Trend: Bullish.
YSFG Year 2026
- Long-Term
- YSFG Current: NA%
- F0%/NTZ' Bias: Price Bullish,
- YSFG Trend: Bullish.
Swing Pivots
- (Short-Term) 1. Pvt. Trend: UTrend,
- (Intermediate-Term) 2. HiLo Trend: UTrend,
- 3. Pvt. Evolve: Pvt high 734.58,
- 4. Pvt. Next: Pvt low 571.82,
- 5. Levels R: 748.65, 734.58,
- 6. Levels S: 661.14, 555.60, 422.67, 413.07, 342.35.
Weekly Benchmarks
- (Short-Term) 5 Day: 714.39 Up Trend,
- (Short-Term) 10 Day: 709.61 Up Trend,
- (Intermediate-Term) 20 Day: 706.35 Up Trend,
- (Intermediate-Term) 55 Day: 643.78 Up Trend,
- (Long-Term) 100 Day: 582.39 Up Trend,
- (Long-Term) 200 Day: 481.46 Up Trend.
Overall Rating
- Short-Term: Bullish,
- Intermediate-Term: Bullish,
- Long-Term: Bullish.
Key Insights Summary
QQQ remains in a broad futures-style swing advance, with price above every benchmark and the moving-average structure positively stacked from the 5-period through the 200-period measure. The short-term pivot structure is in an UTrend following the 657.18 higher-low area, while 734.58 is the active swing-high reference and 748.65 is the higher resistance objective. Large weekly bars and fast momentum reflect an expanded-volatility advance rather than a quiet consolidation. The 661.14 pivot-support area is the nearest structural retracement reference; beneath it, 555.60 is the major intermediate swing support. Price is materially above the yearly NTZ/F0% zone, confirming a bullish long-cycle condition, although the recent approach toward prior highs shows a two-sided, volatile auction near overhead resistance.
Chart Analysis ATS AI Generated: 2026-09-03 07:09 for Informational use only, not trading advice. Terms and Risk Disclosure Copyright © 2026. Algo Trading Systems LLC.