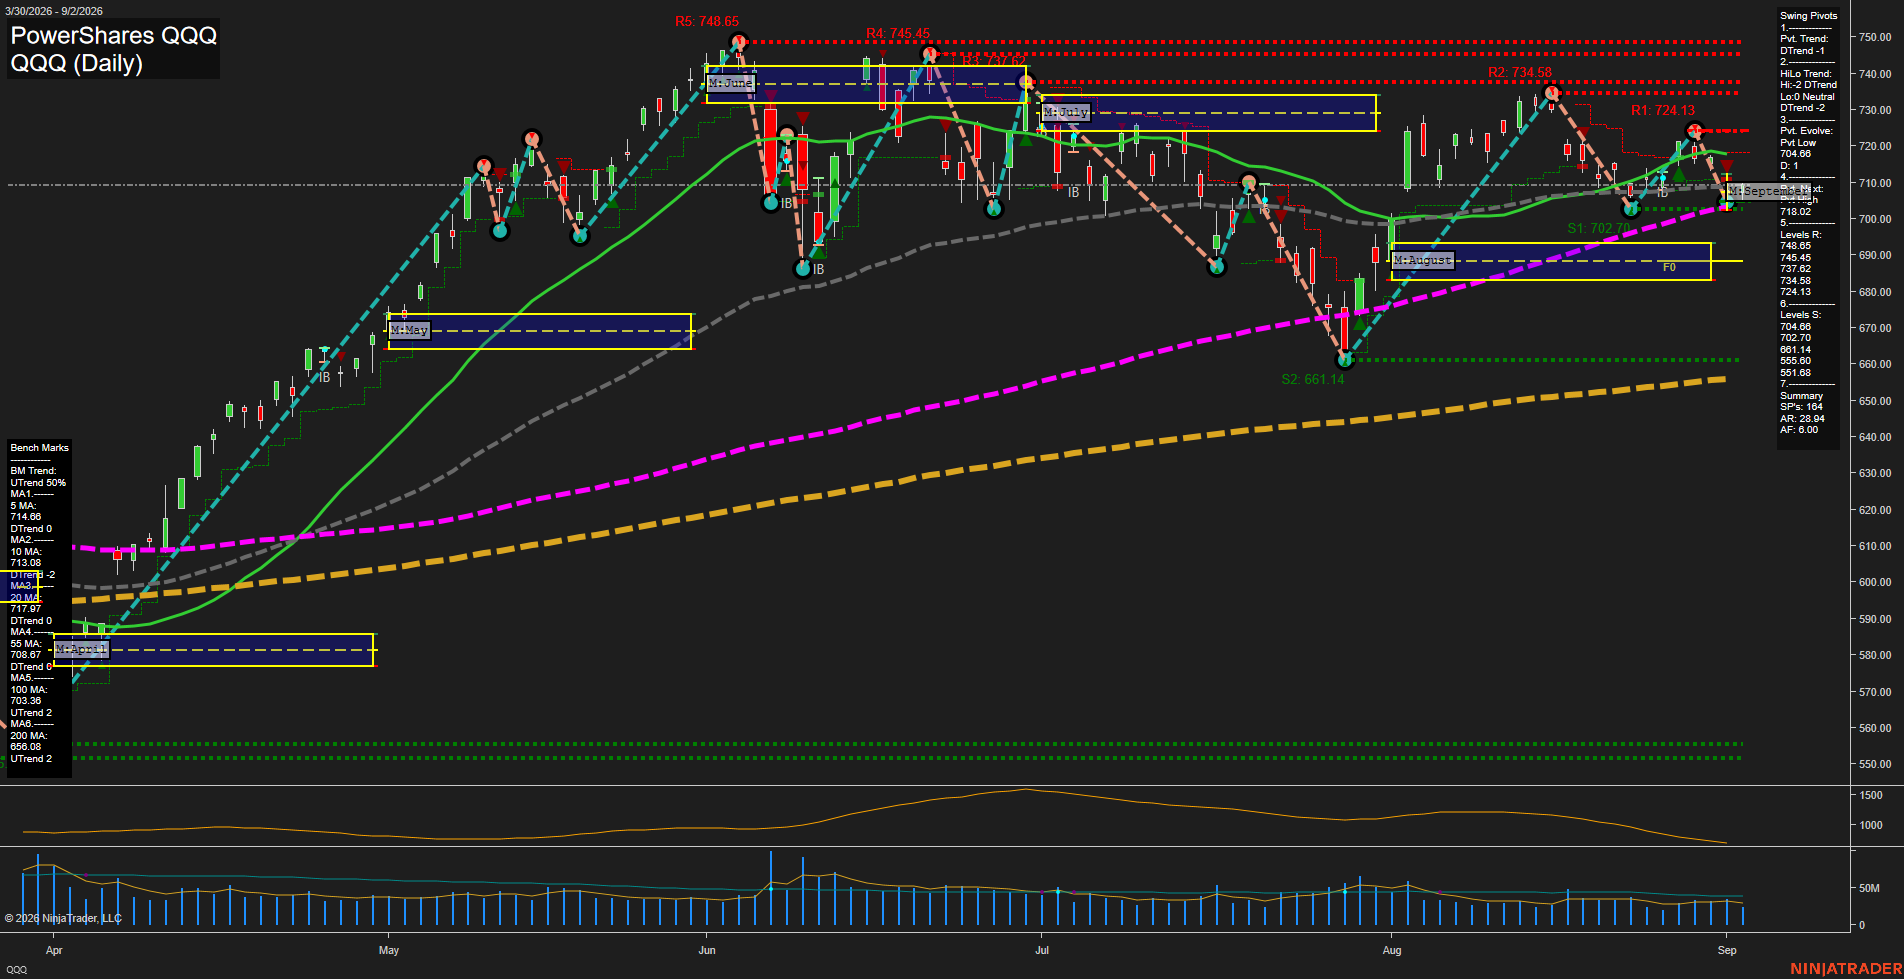
QQQ PowerShares QQQ Daily Chart Analysis: 2026-Sep-03 07:08 CT
Price Action
- Last: 710.11,
- Bars: Small,
- Mom: Slow.
WSFG Weekly
- Short-Term
- WSFG Current: NA%
- F0%/NTZ' Bias: Price Neutral,
- WSFG Trend: Neutral.
MSFG Month Sep
- Intermediate-Term
- MSFG Current: NA%
- F0%/NTZ' Bias: Price Bearish,
- MSFG Trend: Bearish.
YSFG Year 2026
- Long-Term
- YSFG Current: NA%
- F0%/NTZ' Bias: Price Bullish,
- YSFG Trend: Bullish.
Swing Pivots
- (Short-Term) 1. Pvt. Trend: DTrend,
- (Intermediate-Term) 2. HiLo Trend: DTrend,
- 3. Pvt. Evolve: Pvt low 704.66,
- 4. Pvt. Next: Pvt high 724.13,
- 5. Levels R: 748.65, 745.45, 737.62, 734.58, 724.13,
- 6. Levels S: 704.66, 702.70, 661.14, 555.60, 551.68.
Daily Benchmarks
- (Short-Term) 5 Day: 714.66 Up Trend,
- (Short-Term) 10 Day: 713.08 Down Trend,
- (Intermediate-Term) 20 Day: 717.79 Down Trend,
- (Intermediate-Term) 55 Day: 708.87 Up Trend,
- (Long-Term) 100 Day: 703.38 Up Trend,
- (Long-Term) 200 Day: 656.08 Up Trend.
Additional Metrics
- ATR: 28.94,
- VOLMA: 32709273.
Overall Rating
- Short-Term: Bearish,
- Intermediate-Term: Neutral,
- Long-Term: Bullish.
Key Insights Summary
QQQ is in a short-term corrective downswing, with small-range price action holding near the 55-day benchmark after rejection from the 724.13 pivot resistance zone. The active pivot structure remains DTrend and the 10-day and 20-day averages are declining, while 704.66 and 702.70 form the immediate support cluster. From a futures swing-trader perspective, the market is compressing between that nearby support shelf and 724.13 resistance, with reduced momentum and softer volume participation. The intermediate structure is mixed because price remains above rising 55-day and 100-day benchmarks, while the broader long-term trend remains constructive above the rising 200-day average.
Chart Analysis ATS AI Generated: 2026-09-03 07:09 for Informational use only, not trading advice. Terms and Risk Disclosure Copyright © 2026. Algo Trading Systems LLC.