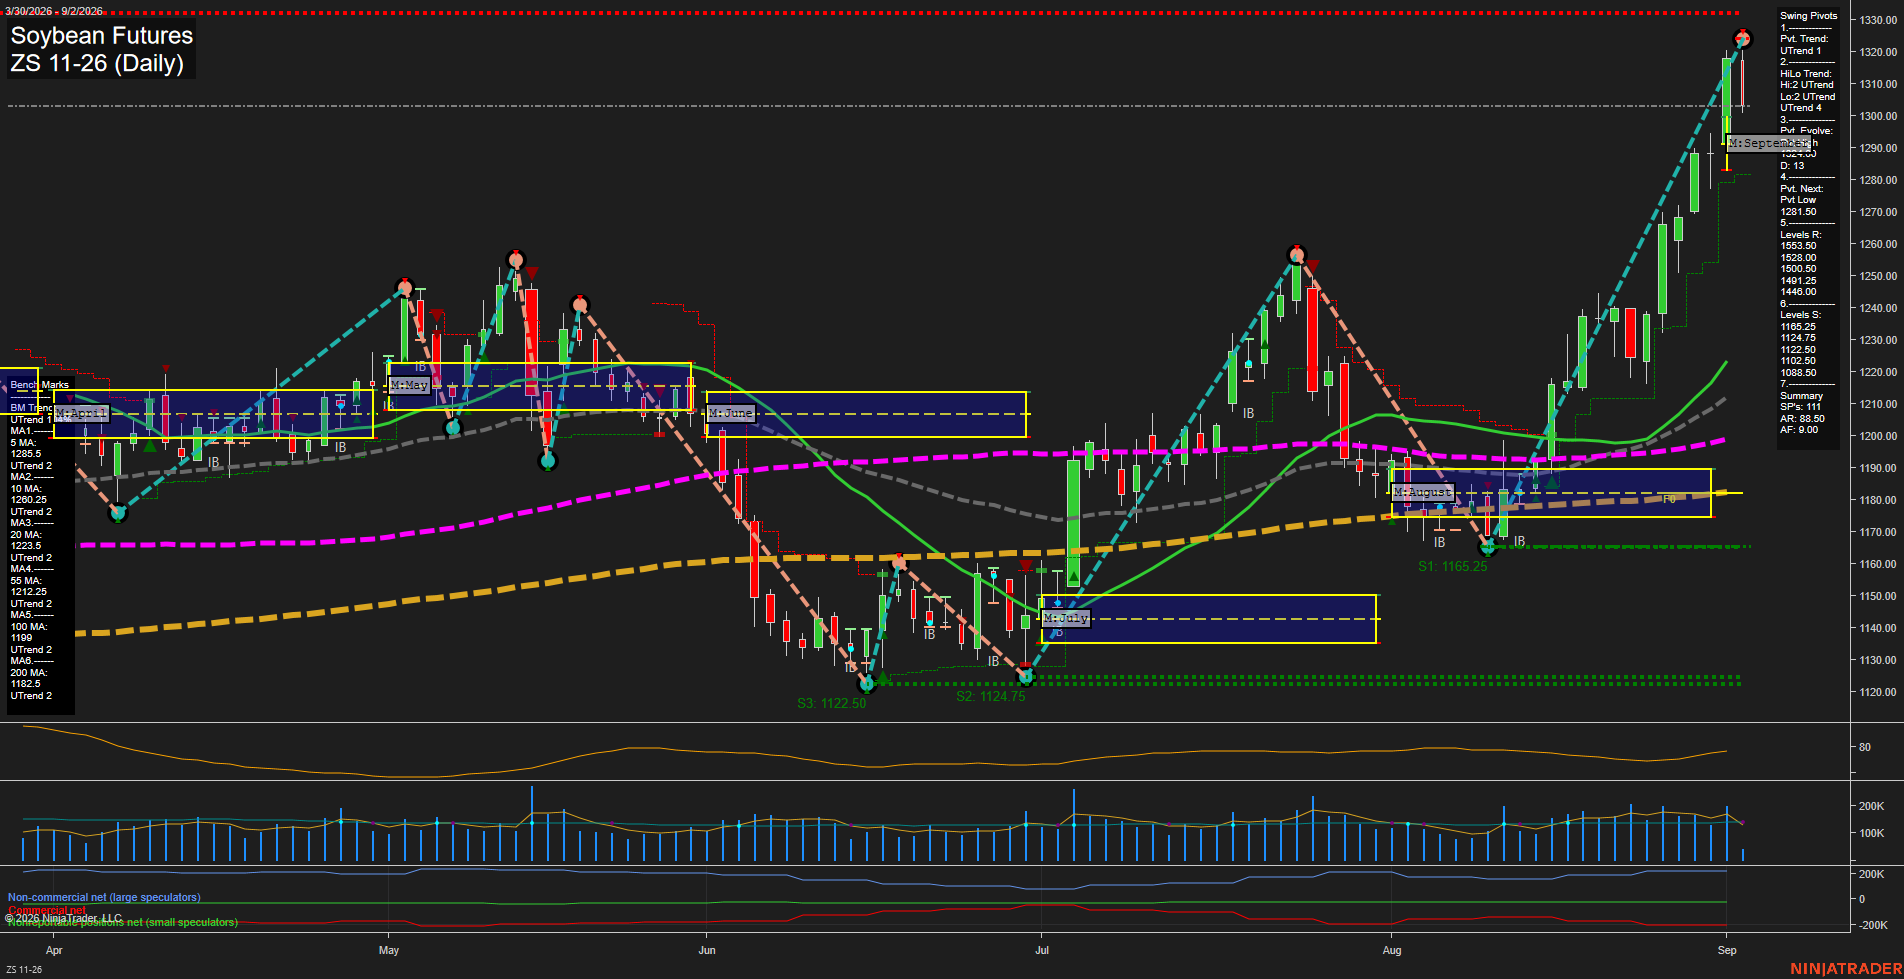
ZS Soybean Futures Daily Chart Analysis: 2026-Sep-02 07:15 CT
Price Action
- Last: 1302.00,
- Bars: Large,
- Mom: fast.
WSFG Weekly
- Short-Term
- WSFG Current: 31%
- F0%/NTZ' Bias: Price Above,
- WSFG Trend: Up.
MSFG Month Sep
- Intermediate-Term
- MSFG Current: 5%
- F0%/NTZ' Bias: Price Above,
- MSFG Trend: Up.
YSFG Year 2026
- Long-Term
- YSFG Current: 60%
- F0%/NTZ' Bias: Price Above,
- YSFG Trend: Up.
Swing Pivots
- (Short-Term) 1. Pvt. Trend: UTrend,
- (Intermediate-Term) 2. HiLo Trend: UTrend,
- 3. Pvt. Evolve: Pvt high 1323.00,
- 4. Pvt. Next: Pvt low 1281.50,
- 5. Levels R: 1537.00, 1528.00, 1505.00, 1449.50, 1446.00,
- 6. Levels S: 1165.25, 1134.75, 1122.50, 1102.50, 1088.50.
Daily Benchmarks
- (Short-Term) 5 Day: 1284.50 Up Trend,
- (Short-Term) 10 Day: 1260.25 Up Trend,
- (Intermediate-Term) 20 Day: 1223.50 Up Trend,
- (Intermediate-Term) 55 Day: 1212.25 Up Trend,
- (Long-Term) 100 Day: 1194.00 Up Trend,
- (Long-Term) 200 Day: 1182.50 Up Trend.
Additional Metrics
Recent Trade Signals
- 01 Sep 2026: Long ZS 11-26 @ 1310.5 Signals.USAR-MSFG
- 01 Sep 2026: Long ZS 11-26 @ 1299 Signals.USAR-WSFG
Overall Rating
- Short-Term: Bullish,
- Intermediate-Term: Bullish,
- Long-Term: Bullish.
Key Insights Summary
Soybeans remain in a broad multi-timeframe advance, with price above the weekly, monthly, and yearly fib-grid reference areas and above all rising benchmark averages. The latest sharp push to a 1323.00 pivot high reflects fast upside momentum and large daily ranges, while the pullback toward 1302.00 shows short-term profit-taking after an extended vertical rally. The pivot structure remains constructive with higher lows and UTrend readings in both short- and intermediate-term measures. The 1281.50 pivot-next level defines the near-term structural reversal reference, while the moving-average cluster from 1223.50 to 1284.50 remains well below current price and confirms strong upside separation. Volume has been active during the advance, and ATR near 82 indicates elevated daily movement consistent with a volatile breakout phase.
Chart Analysis ATS AI Generated: 2026-09-02 07:15 for Informational use only, not trading advice. Terms and Risk Disclosure Copyright © 2026. Algo Trading Systems LLC.