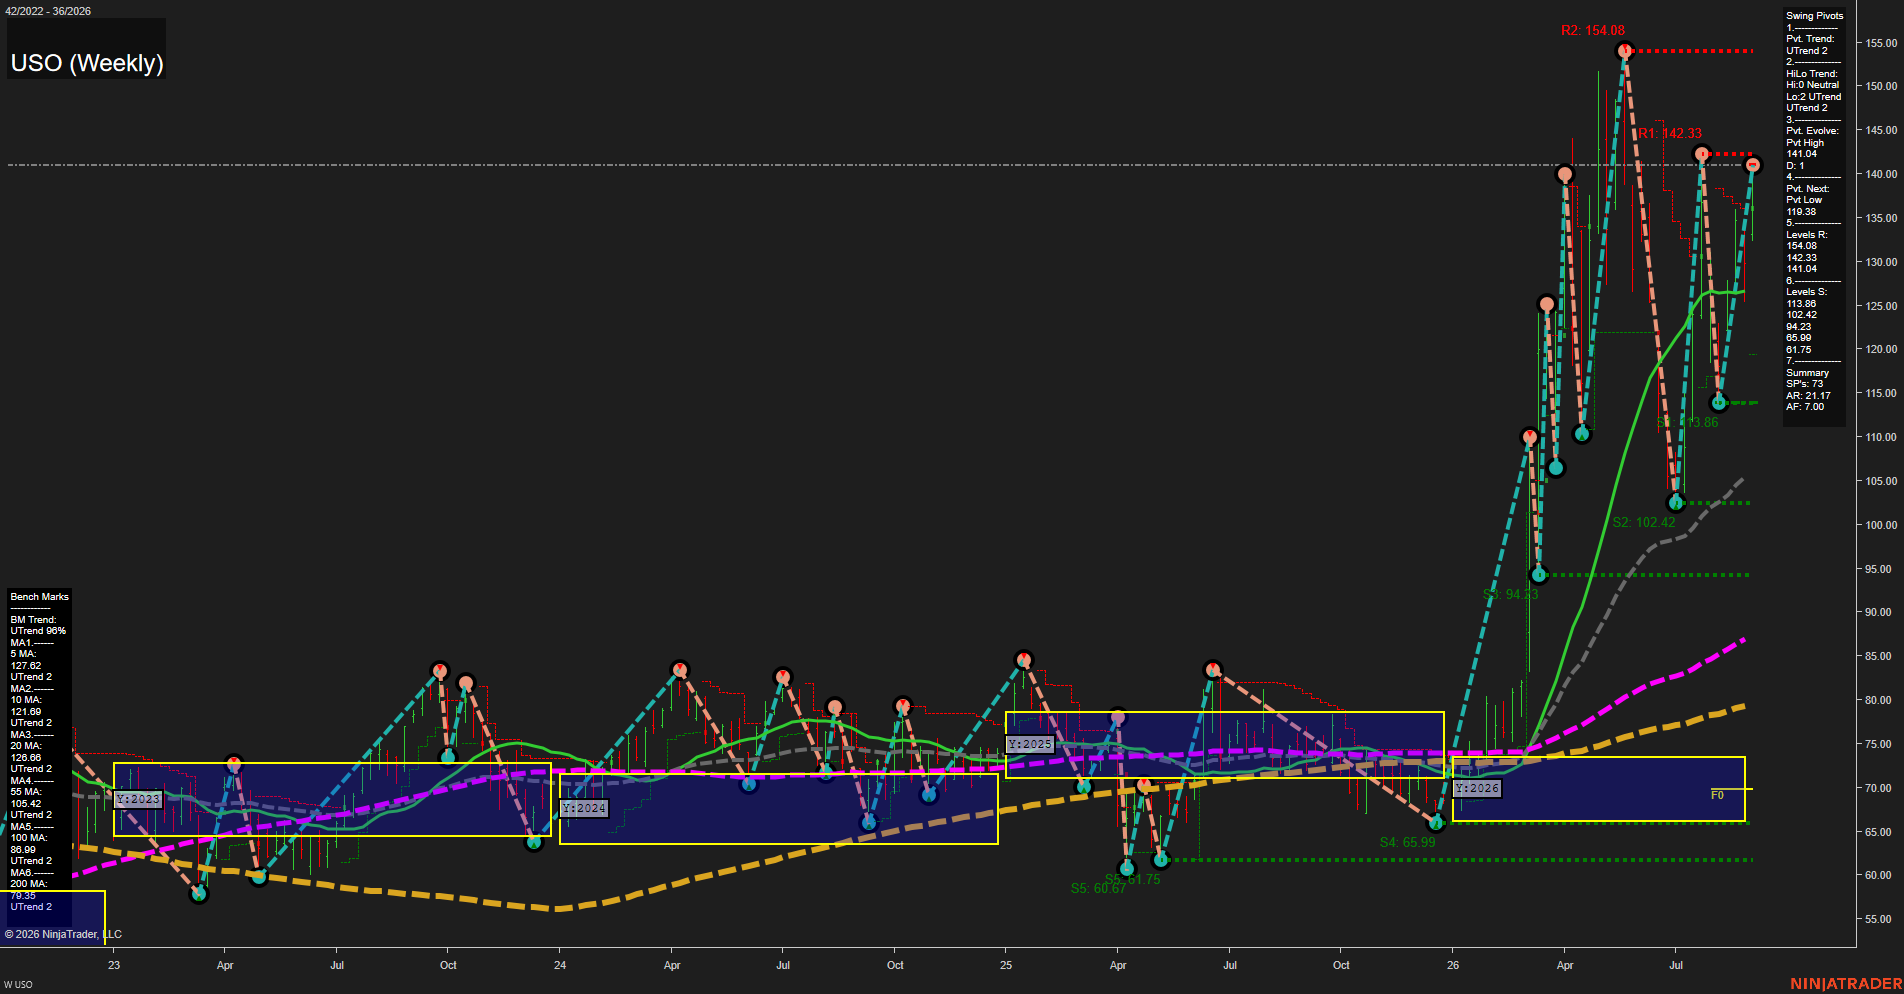
USO United States Oil Fund LP Weekly Chart Analysis: 2026-Sep-02 07:13 CT
Price Action
- Last: 141.04,
- Bars: Large,
- Mom: fast.
WSFG Weekly
- Short-Term
- WSFG Current: NA%
- F0%/NTZ' Bias: Price Above NTZ,
- WSFG Trend: Bullish.
MSFG Month Sep
- Intermediate-Term
- MSFG Current: NA%
- F0%/NTZ' Bias: Price Above NTZ,
- MSFG Trend: Bullish.
YSFG Year 2026
- Long-Term
- YSFG Current: NA%
- F0%/NTZ' Bias: Price Above NTZ,
- YSFG Trend: Bullish.
Swing Pivots
- (Short-Term) 1. Pvt. Trend: UTrend,
- (Intermediate-Term) 2. HiLo Trend: UTrend,
- 3. Pvt. Evolve: Pvt high 141.02,
- 4. Pvt. Next: Pvt low 119.38,
- 5. Levels R: 154.08, 142.33, 141.04,
- 6. Levels S: 113.86, 102.42, 94.23, 65.99, 61.75.
Weekly Benchmarks
- (Short-Term) 5 Day: 127.62 Up Trend,
- (Short-Term) 10 Day: 121.69 Up Trend,
- (Intermediate-Term) 20 Day: 126.00 Up Trend,
- (Intermediate-Term) 55 Day: 105.42 Up Trend,
- (Long-Term) 100 Day: 86.99 Up Trend,
- (Long-Term) 200 Day: 78.31 Up Trend.
Overall Rating
- Short-Term: Bullish,
- Intermediate-Term: Bullish,
- Long-Term: Bullish.
Key Insights Summary
USO displays a strong futures-style expansion phase, with fast upside momentum and price holding materially above every weekly benchmark. The swing structure remains constructive: both the short-term pivot trend and intermediate HiLo trend are in UTrend, while the latest advance has returned price to the 141.04 pivot-resistance area. The nearby 142.33 resistance is the immediate ceiling within the current swing, followed by the major 154.08 high. Support is layered at 113.86 and 102.42, defining the prior high-volatility pullback zone. The wide separation above the 20-, 55-, 100-, and 200-period averages reflects a mature but persistent upside repricing cycle rather than a base-building consolidation.
Chart Analysis ATS AI Generated: 2026-09-02 07:13 for Informational use only, not trading advice. Terms and Risk Disclosure Copyright © 2026. Algo Trading Systems LLC.