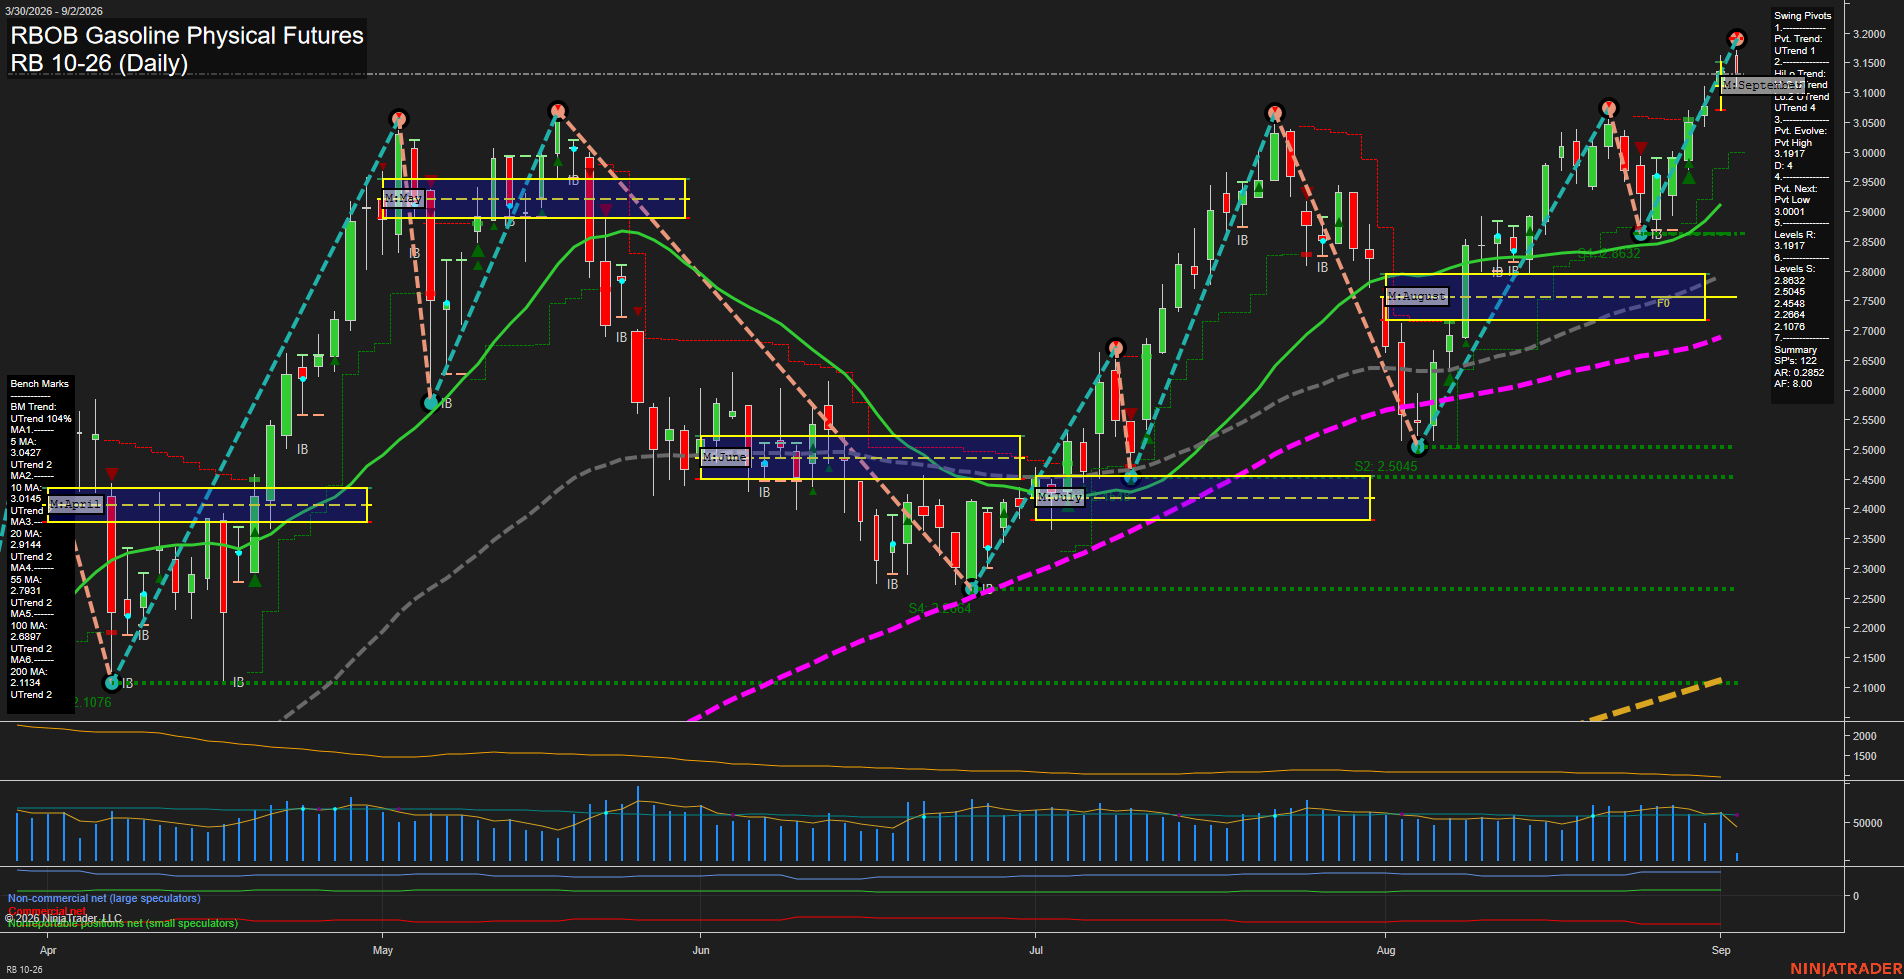
RB RBOB Gasoline Physical Futures Daily Chart Analysis: 2026-Sep-02 07:09 CT
Price Action
- Last: 3.1917,
- Bars: Large,
- Mom: Fast.
WSFG Weekly
- Short-Term
- WSFG Current: 33%
- F0%/NTZ' Bias: Price Above,
- WSFG Trend: Up.
MSFG Month Sep
- Intermediate-Term
- MSFG Current: 2%
- F0%/NTZ' Bias: Price Above,
- MSFG Trend: Up.
YSFG Year 2026
- Long-Term
- YSFG Current: 199%
- F0%/NTZ' Bias: Price Above,
- YSFG Trend: Up.
Swing Pivots
- (Short-Term) 1. Pvt. Trend: UTrend,
- (Intermediate-Term) 2. HiLo Trend: UTrend,
- 3. Pvt. Evolve: Pvt high 3.1917,
- 4. Pvt. Next: Pvt low 3.0001,
- 5. Levels R: 3.1917,
- 6. Levels S: 2.8504, 2.5448, 2.2684, 2.1076.
Daily Benchmarks
- (Short-Term) 5 Day: 3.0427 Up Trend,
- (Short-Term) 10 Day: 3.0145 Up Trend,
- (Intermediate-Term) 20 Day: 2.9144 Up Trend,
- (Intermediate-Term) 55 Day: 2.7931 Up Trend,
- (Long-Term) 100 Day: 2.6882 Up Trend,
- (Long-Term) 200 Day: 2.1134 Up Trend.
Additional Metrics
Recent Trade Signals
- 01 Sep 2026: Long RB 10-26 @ 3.0991 Signals.USAR-WSFG
- 26 Aug 2026: Long RB 10-26 @ 2.9775 Signals.USAR.TR120
Overall Rating
- Short-Term: Bullish,
- Intermediate-Term: Bullish,
- Long-Term: Bullish.
Key Insights Summary
RB is in a broad, aligned advance with price above every benchmark average, a confirmed UTrend in both pivot measures, and a fast push through the 3.15 area into a new pivot high at 3.1917. The recent structure reflects higher highs and higher lows following the August recovery, while the 3.0001 pivot-next level defines the nearest short-term reversal reference. The September monthly grid is being traded above its F0%/NTZ area, reinforcing intermediate strength; the extended yearly reading and fast momentum also characterize the advance as elevated and increasingly momentum-driven. Volume is active but the latest breakout bar appears to be a decisive continuation bar rather than a broad consolidation pattern.
Chart Analysis ATS AI Generated: 2026-09-02 07:10 for Informational use only, not trading advice. Terms and Risk Disclosure Copyright © 2026. Algo Trading Systems LLC.