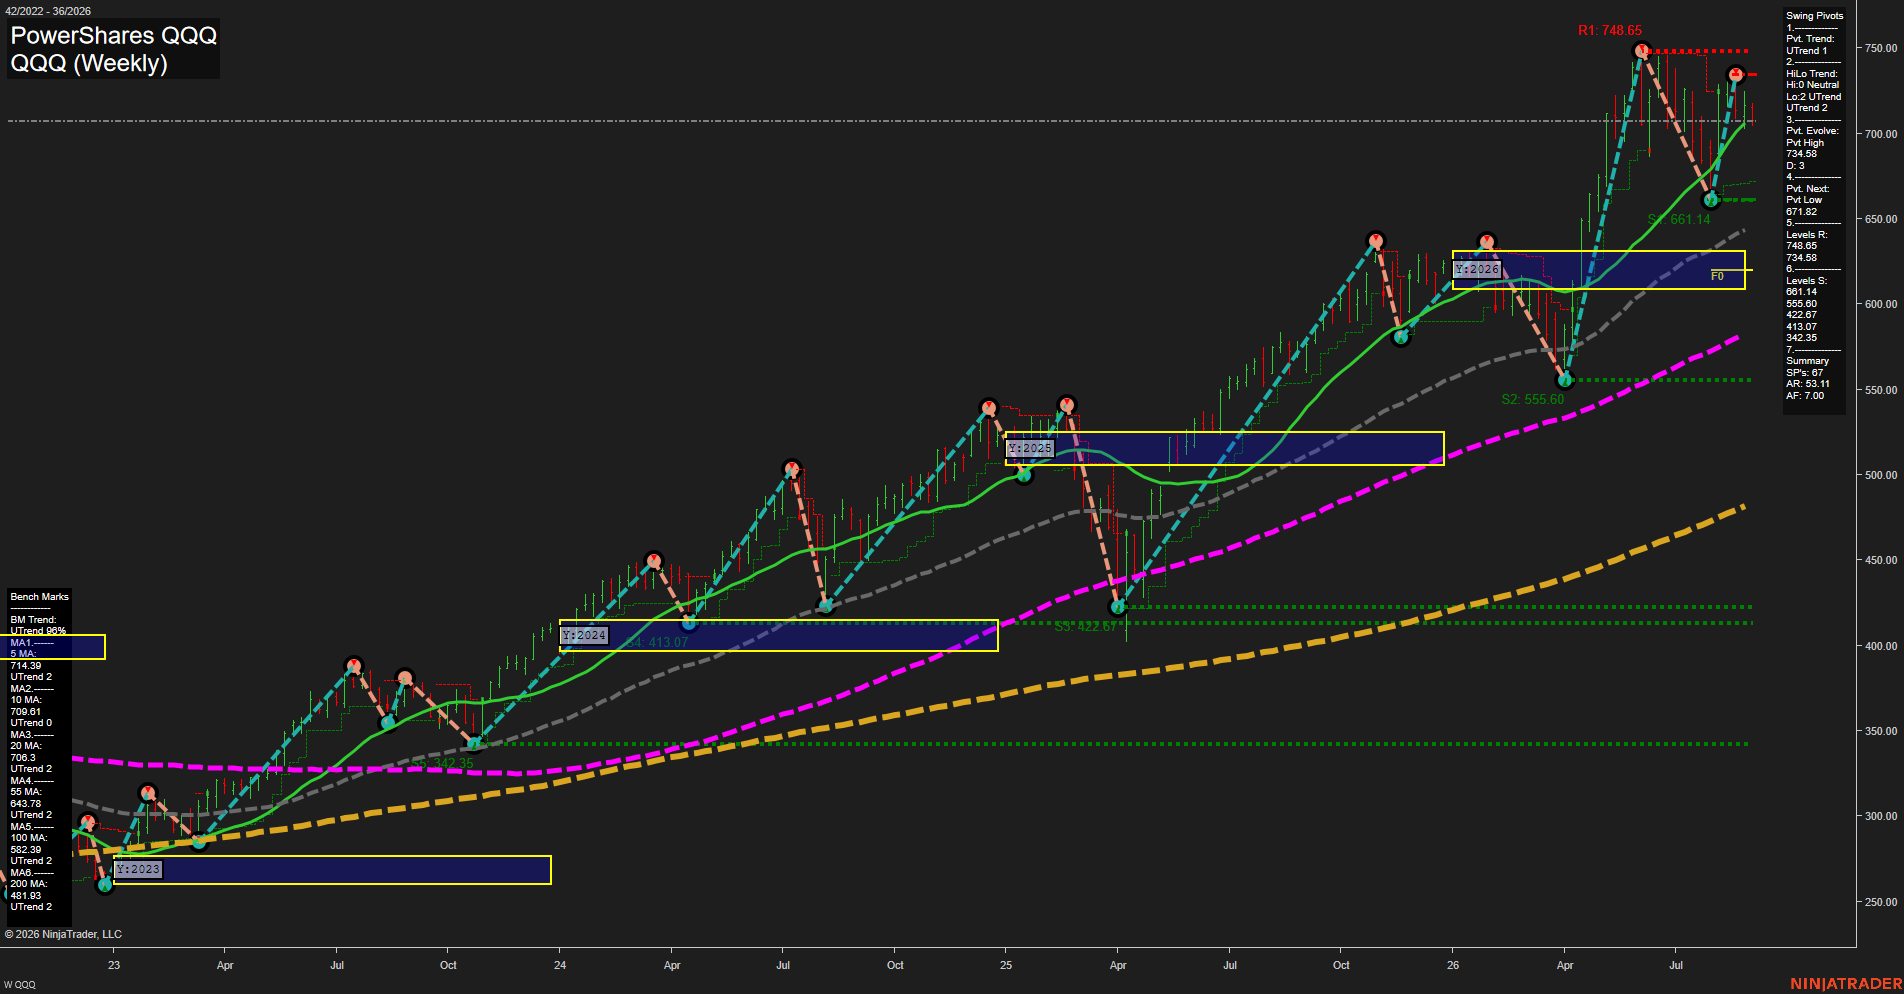
QQQ PowerShares QQQ Weekly Chart Analysis: 2026-Sep-02 07:09 CT
Price Action
- Last: 714.88,
- Bars: Medium,
- Mom: fast.
WSFG Weekly
- Short-Term
- WSFG Current: NA%
- F0%/NTZ' Bias: Price Above NTZ,
- WSFG Trend: Uptrend.
MSFG Month Sep
- Intermediate-Term
- MSFG Current: NA%
- F0%/NTZ' Bias: Price Above NTZ,
- MSFG Trend: Uptrend.
YSFG Year 2026
- Long-Term
- YSFG Current: NA%
- F0%/NTZ' Bias: Price Above NTZ,
- YSFG Trend: Uptrend.
Swing Pivots
- (Short-Term) 1. Pvt. Trend: UTrend,
- (Intermediate-Term) 2. HiLo Trend: UTrend,
- 3. Pvt. Evolve: Pvt high 734.58,
- 4. Pvt. Next: Pvt low 671.82,
- 5. Levels R: 748.65, 743.58, 734.58,
- 6. Levels S: 661.14, 555.60, 422.67, 413.07, 342.35.
Weekly Benchmarks
- (Short-Term) 5 Day: 714.88 Up Trend,
- (Short-Term) 10 Day: 709.61 Up Trend,
- (Intermediate-Term) 20 Day: 706.30 Up Trend,
- (Intermediate-Term) 55 Day: 643.78 Up Trend,
- (Long-Term) 100 Day: 582.39 Up Trend,
- (Long-Term) 200 Day: 481.04 Up Trend.
Overall Rating
- Short-Term: Bullish,
- Intermediate-Term: Bullish,
- Long-Term: Bullish.
Key Insights Summary
QQQ remains in a broad weekly markup phase, with price holding above every benchmark average and the moving-average structure strongly stacked upward. The recent advance produced a fast V-shaped recovery from the 555.60 pivot-support region, followed by a test of the 734.58 to 748.65 resistance area. Current price action is consolidating below that upper pivot band, leaving 661.14 as the nearest meaningful weekly swing reference. From a futures swing-trader perspective, the dominant structure remains higher highs and higher lows, while the short-term tape is comparatively extended and displaying increased two-way volatility beneath major resistance.
Chart Analysis ATS AI Generated: 2026-09-02 07:09 for Informational use only, not trading advice. Terms and Risk Disclosure Copyright © 2026. Algo Trading Systems LLC.