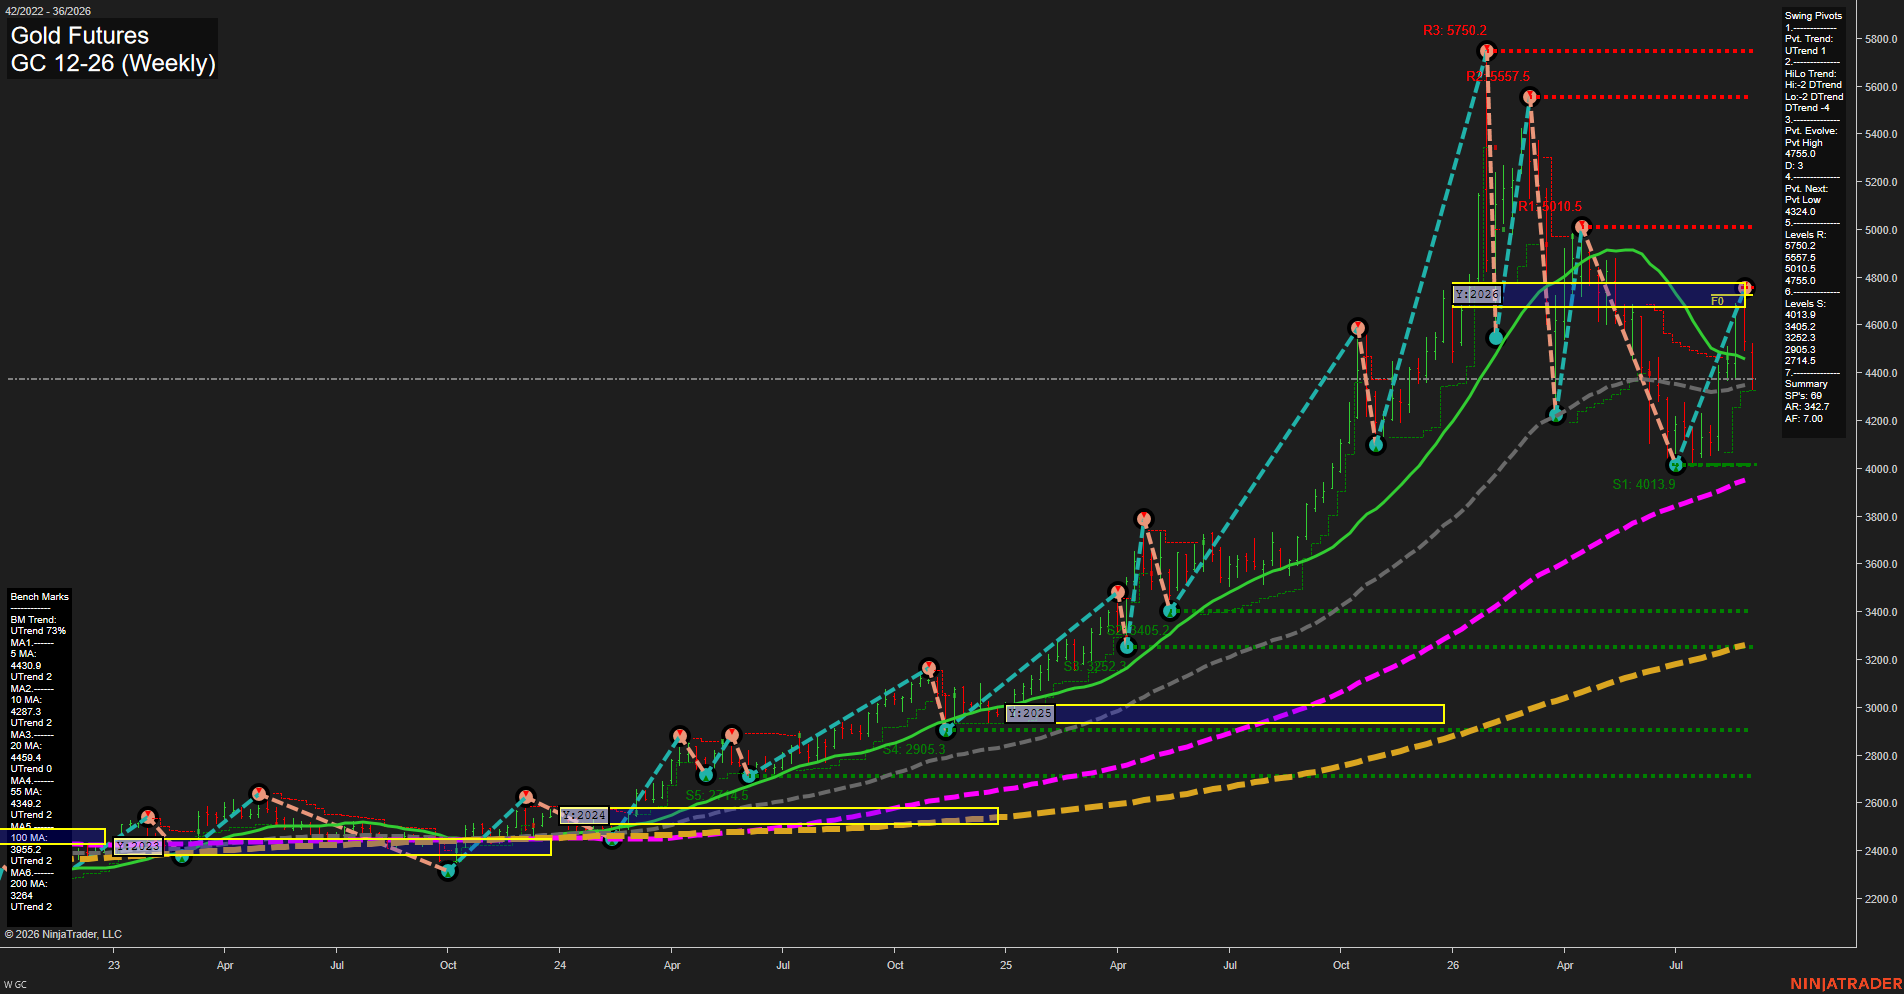
GC Gold Futures Weekly Chart Analysis: 2026-Sep-02 07:06 CT
Price Action
- Last: 4481.0,
- Bars: Medium,
- Mom: Fast.
WSFG Weekly
- Short-Term
- WSFG Current: -39%
- F0%/NTZ' Bias: Price Below,
- WSFG Trend: Down.
MSFG Month Sep
- Intermediate-Term
- MSFG Current: -22%
- F0%/NTZ' Bias: Price Below,
- MSFG Trend: Down.
YSFG Year 2026
- Long-Term
- YSFG Current: -68%
- F0%/NTZ' Bias: Price Below,
- YSFG Trend: Down.
Swing Pivots
- (Short-Term) 1. Pvt. Trend: DTrend,
- (Intermediate-Term) 2. HiLo Trend: DTrend,
- 3. Pvt. Evolve: Pvt high 4755.0,
- 4. Pvt. Next: Pvt low 4324.0,
- 5. Levels R: 5750.2, 5557.5, 5010.5, 4755.0,
- 6. Levels S: 4013.9, 3405.2, 3252.3, 2905.3, 2714.5.
Weekly Benchmarks
- (Short-Term) 5 Day: 4436.9 Up Trend,
- (Short-Term) 10 Day: 4287.3 Up Trend,
- (Intermediate-Term) 20 Day: 4459.4 Up Trend,
- (Intermediate-Term) 55 Day: 4349.2 Up Trend,
- (Long-Term) 100 Day: 3955.2 Up Trend,
- (Long-Term) 200 Day: 3284.4 Up Trend.
Recent Trade Signals
- 01 Sep 2026: Short GC 12-26 @ 4423 Signals.USAR-WSFG
- 01 Sep 2026: Short GC 12-26 @ 4413.7 Signals.USAR-MSFG
- 26 Aug 2026: Short GC 12-26 @ 4649 Signals.USAR.TR120
Overall Rating
- Short-Term: Bearish,
- Intermediate-Term: Bearish,
- Long-Term: Bullish.
Key Insights Summary
Gold is staging a fast rebound from the 4013.9 swing-support area, with price recovering above the 5-, 10-, 20-, and 55-week benchmarks. The active pivot structure remains bearish, however, defined by the 4755.0 pivot high and a 4324.0 opposite-pivot threshold. Weekly and monthly Fib-grid readings remain below their respective F0% levels, reflecting a counter-trend recovery within a broader corrective phase. The larger secular trend remains constructive because price holds well above rising 100- and 200-week averages, while 4755.0 and then 5010.5 define the nearer overhead pivot-resistance sequence.
Chart Analysis ATS AI Generated: 2026-09-02 07:07 for Informational use only, not trading advice. Terms and Risk Disclosure Copyright © 2026. Algo Trading Systems LLC.