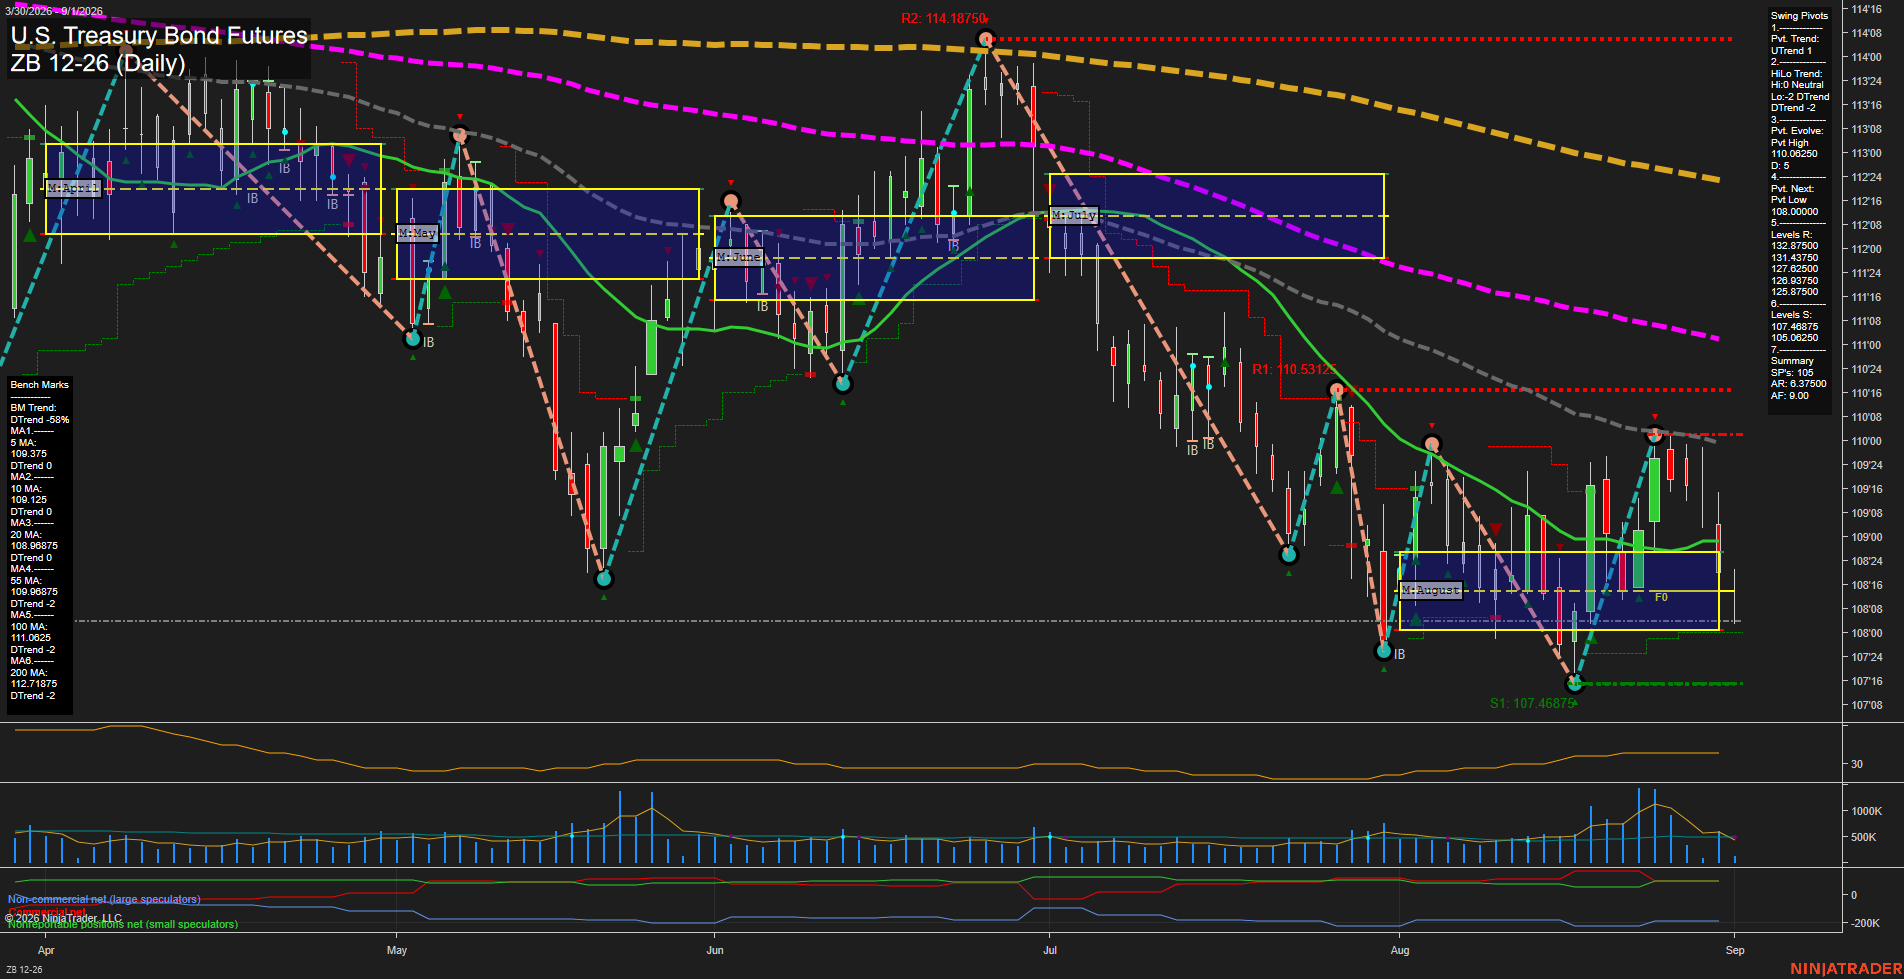
ZB U.S. Treasury Bond Futures Daily Chart Analysis: 2026-Sep-01 07:13 CT
Price Action
- Last: 108.0625,
- Bars: Small,
- Mom: Slow.
WSFG Weekly
- Short-Term
- WSFG Current: NA%
- F0%/NTZ' Bias: Price Neutral,
- WSFG Trend: Neutral.
MSFG Month Sep
- Intermediate-Term
- MSFG Current: NA%
- F0%/NTZ' Bias: Price Neutral,
- MSFG Trend: Neutral.
YSFG Year 2026
- Long-Term
- YSFG Current: NA%
- F0%/NTZ' Bias: Price Neutral,
- YSFG Trend: Neutral.
Swing Pivots
- (Short-Term) 1. Pvt. Trend: UTrend,
- (Intermediate-Term) 2. HiLo Trend: DTrend,
- 3. Pvt. Evolve: Pvt high 110.0000,
- 4. Pvt. Next: Pvt low 108.0000,
- 5. Levels R: 132.8750, 131.4375, 128.9375, 127.6250, 125.8750,
- 6. Levels S: 107.46875, 105.06250.
Daily Benchmarks
- (Short-Term) 5 Day: 109.3750 Down Trend,
- (Short-Term) 10 Day: 109.1250 Down Trend,
- (Intermediate-Term) 20 Day: 108.96875 Down Trend,
- (Intermediate-Term) 55 Day: 109.6875 Down Trend,
- (Long-Term) 100 Day: 110.0625 Down Trend,
- (Long-Term) 200 Day: 112.71875 Down Trend.
Additional Metrics
Overall Rating
- Short-Term: Bearish,
- Intermediate-Term: Bearish,
- Long-Term: Bearish.
Key Insights Summary
Price remains beneath every daily benchmark, with the declining 5, 10, 20, 55, 100, and 200 day averages showing broad multi-timeframe downside alignment. The recent rebound from 107.46875 produced a short-term UTrend pivot condition, but the recovery stalled below the nearby moving-average cluster and has rotated back toward the 108.0000 next-pivot-low threshold. Small daily bars and slower momentum indicate consolidation following the late-August volatility expansion, while the intermediate HiLo structure remains a DTrend. A sustained move below 108.0000 would reinforce the broader lower-high and lower-low sequence toward 107.46875 support; the principal recovery reference remains the 110.0000 pivot-high area.
Chart Analysis ATS AI Generated: 2026-09-01 07:14 for Informational use only, not trading advice. Terms and Risk Disclosure Copyright © 2026. Algo Trading Systems LLC.