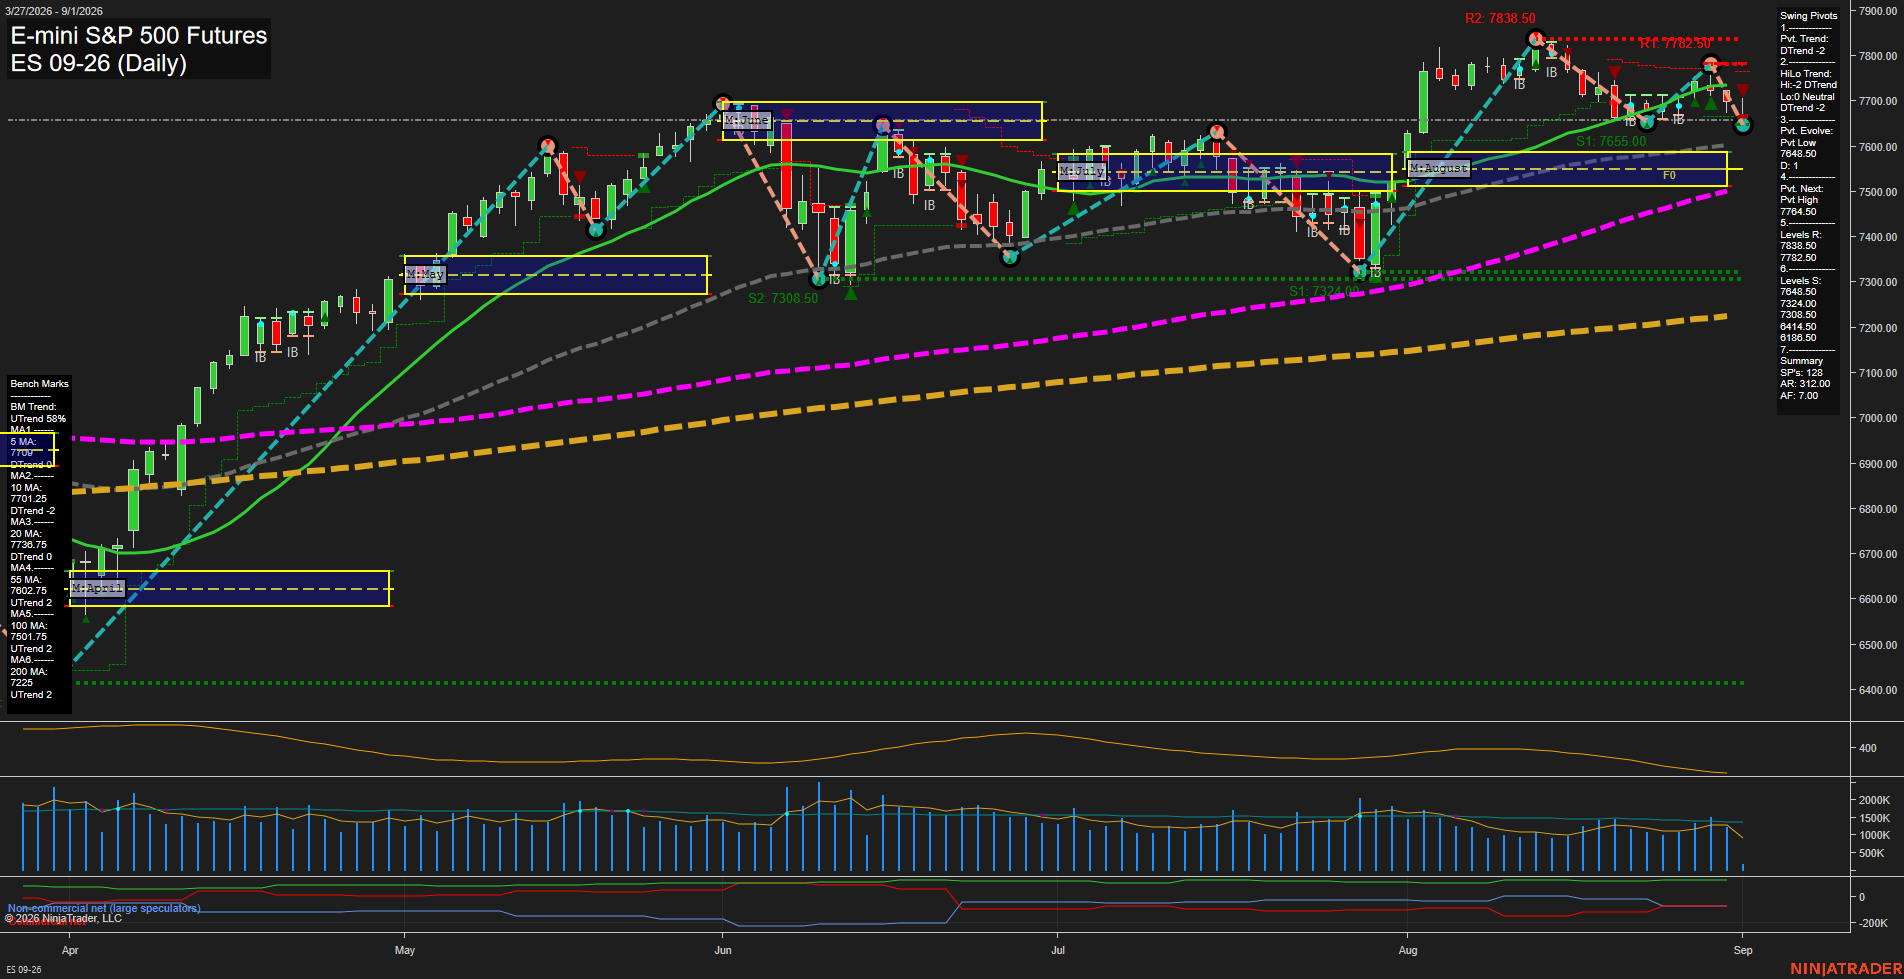
ES E-mini S&P 500 Futures Daily Chart Analysis: 2026-Sep-01 07:04 CT
Price Action
- Last: 7653.5,
- Bars: Medium,
- Mom: fast.
WSFG Weekly
- Short-Term
- WSFG Current: -42%
- F0%/NTZ' Bias: Price Below,
- WSFG Trend: Down.
MSFG Month Sep
- Intermediate-Term
- MSFG Current: -12%
- F0%/NTZ' Bias: Price Below,
- MSFG Trend: Down.
YSFG Year 2026
- Long-Term
- YSFG Current: 54%
- F0%/NTZ' Bias: Price Above,
- YSFG Trend: Up.
Swing Pivots
- (Short-Term) 1. Pvt. Trend: DTrend,
- (Intermediate-Term) 2. HiLo Trend: DTrend,
- 3. Pvt. Evolve: Pvt low 7648.50,
- 4. Pvt. Next: Pvt high 7784.50,
- 5. Levels R: 7838.50, 7782.50,
- 6. Levels S: 7648.50, 7324.00, 7308.50, 6848.50, 6732.00, 6414.50, 6185.00.
Daily Benchmarks
- (Short-Term) 5 Day: 7709.00 Down Trend,
- (Short-Term) 10 Day: 7701.25 Down Trend,
- (Intermediate-Term) 20 Day: 7730.75 Down Trend,
- (Intermediate-Term) 55 Day: 7602.75 Up Trend,
- (Long-Term) 100 Day: 7501.75 Up Trend,
- (Long-Term) 200 Day: 7225.00 Up Trend.
Additional Metrics
- ATR: 319,
- VOLMA: 1611996.
Recent Trade Signals
- 01 Sep 2026: Short ES 09-26 @ 7653.5 Signals.USAR-MSFG
- 01 Sep 2026: Short ES 09-26 @ 7692.75 Signals.USAR-WSFG
- 31 Aug 2026: Short ES 09-26 @ 7689.75 Signals.USAR.TR120
Overall Rating
- Short-Term: Bearish,
- Intermediate-Term: Bearish,
- Long-Term: Bullish.
Key Insights Summary
Price has rolled over sharply from the 7838.50 swing-high region, creating a short-term lower-high and lower-low sequence. The close beneath the weekly and monthly Fib-grid centers, the declining 5-, 10-, and 20-day benchmarks, and aligned DTrend pivot readings define the active swing structure as bearish. The 7648.50 pivot-low support is the immediate structural reference, while 7782.50 and 7838.50 remain the overhead pivot-resistance zone. Longer-term structure remains constructive because price is still above rising 55-, 100-, and 200-day benchmarks and the yearly Fib-grid bias remains positive; the current move is therefore a meaningful intermediate pullback within a broader long-term uptrend. Declining ATR from the late-August peak indicates volatility compression following the reversal, while volume remains active relative to recent sessions.
Chart Analysis ATS AI Generated: 2026-09-01 07:04 for Informational use only, not trading advice. Terms and Risk Disclosure Copyright © 2026. Algo Trading Systems LLC.