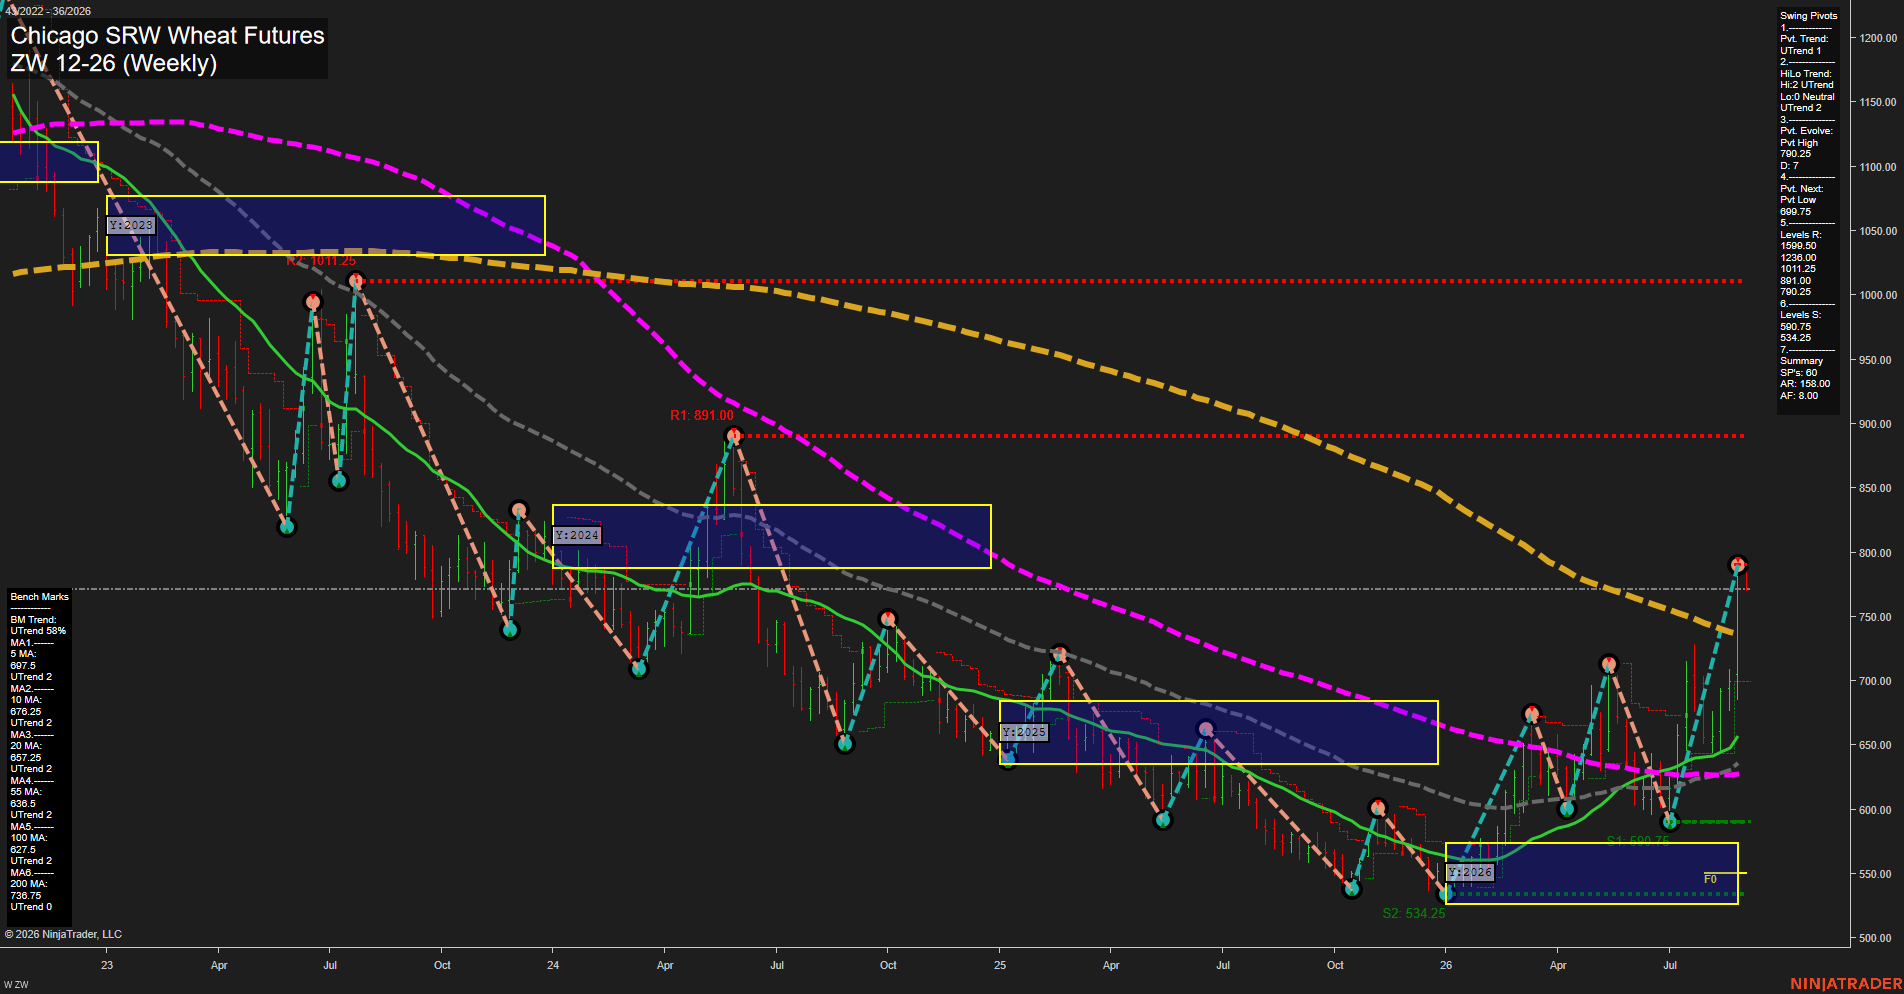
ZW Chicago SRW Wheat Futures Weekly Chart Analysis: 2026-Aug-31 07:13 CT
Price Action
- Last: 699.00,
- Bars: Medium,
- Mom: Fast.
WSFG Weekly
- Short-Term
- WSFG Current: -23%
- F0%/NTZ' Bias: Price Below,
- WSFG Trend: Down.
MSFG Month Aug
- Intermediate-Term
- MSFG Current: 139%
- F0%/NTZ' Bias: Price Above,
- MSFG Trend: Up.
YSFG Year 2026
- Long-Term
- YSFG Current: 92%
- F0%/NTZ' Bias: Price Above,
- YSFG Trend: Up.
Swing Pivots
- (Short-Term) 1. Pvt. Trend: UTrend,
- (Intermediate-Term) 2. HiLo Trend: UTrend,
- 3. Pvt. Evolve: Pvt high 790.25,
- 4. Pvt. Next: Pvt low 699.75,
- 5. Levels R: 1599.50, 1236.00, 1011.25, 890.00, 790.25,
- 6. Levels S: 590.75, 534.25.
Weekly Benchmarks
- (Short-Term) 5 Day: 697.50 Up Trend,
- (Short-Term) 10 Day: 676.25 Up Trend,
- (Intermediate-Term) 20 Day: 657.25 Up Trend,
- (Intermediate-Term) 55 Day: 636.50 Up Trend,
- (Long-Term) 100 Day: 627.50 Up Trend,
- (Long-Term) 200 Day: 738.75 Up Trend.
Recent Trade Signals
- 25 Aug 2026: Short ZW 12-26 @ 693.75 Signals.USAR.TR120
- 25 Aug 2026: Short ZW 12-26 @ 699 Signals.USAR-WSFG
Overall Rating
- Short-Term: Bearish,
- Intermediate-Term: Bullish,
- Long-Term: Bullish.
Key Insights Summary
ZW has produced a sharp recovery from the 2026 low near 534.25, creating an intermediate and long-term higher-low structure above the rising 20, 55, and 100 week benchmarks. The recent surge reached the 790.25 pivot-high resistance area and was followed by a medium-sized rejection bar back toward 699, creating fast short-term countertrend momentum beneath the weekly F0%/NTZ bias. Price is testing the 699.75 pivot-reversal level while the 5 week average near 697.50 is immediate trend reference. The broader recovery structure remains intact above 657.25, 636.50, and the 590.75 support zone, while 790.25 and 890.00 define the nearest overhead pivot resistance sequence.
Chart Analysis ATS AI Generated: 2026-08-31 07:13 for Informational use only, not trading advice. Terms and Risk Disclosure Copyright © 2026. Algo Trading Systems LLC.