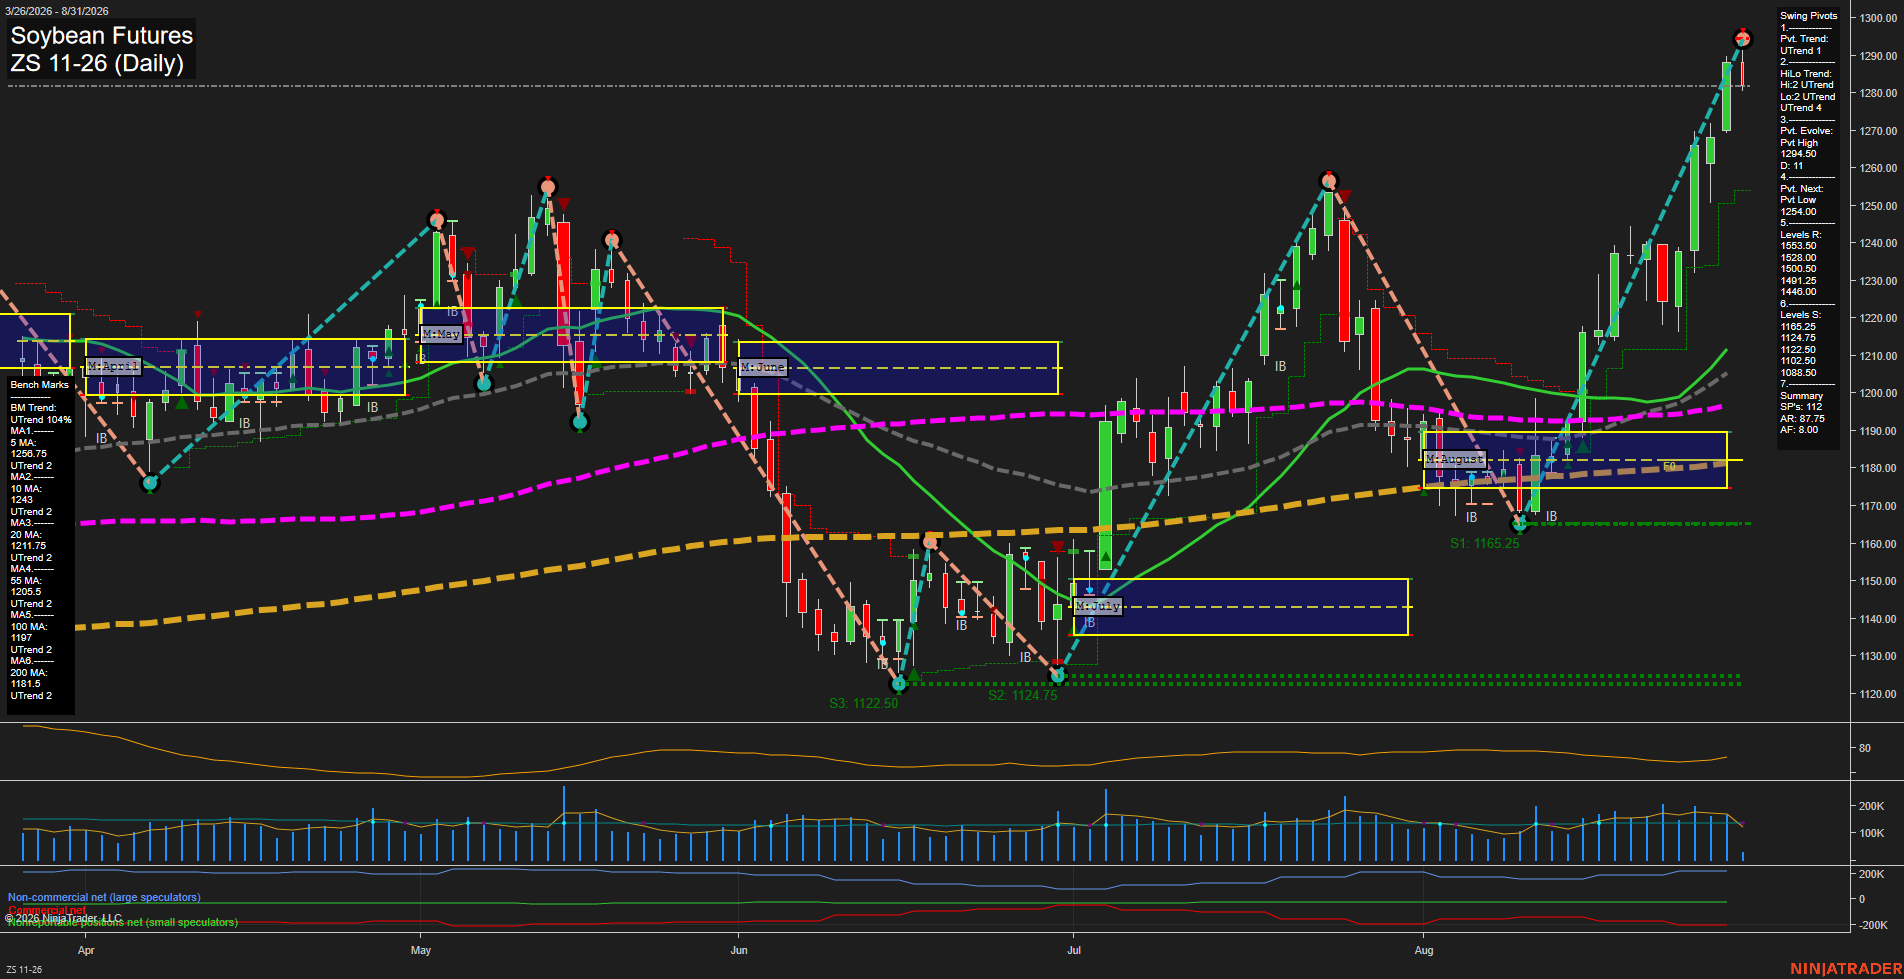
ZS Soybean Futures Daily Chart Analysis: 2026-Aug-31 07:12 CT
Price Action
- Last: 1294.5,
- Bars: Large,
- Mom: fast.
WSFG Weekly
- Short-Term
- WSFG Current: -13%
- F0%/NTZ' Bias: Price Below,
- WSFG Trend: Down.
MSFG Month Aug
- Intermediate-Term
- MSFG Current: 111%
- F0%/NTZ' Bias: Price Above,
- MSFG Trend: Up.
YSFG Year 2026
- Long-Term
- YSFG Current: 53%
- F0%/NTZ' Bias: Price Above,
- YSFG Trend: Up.
Swing Pivots
- (Short-Term) 1. Pvt. Trend: UTrend,
- (Intermediate-Term) 2. HiLo Trend: UTrend,
- 3. Pvt. Evolve: Pvt high 1294.50,
- 4. Pvt. Next: Pvt low 1254.00,
- 5. Levels R: 1593.50, 1528.00, 1509.50, 1494.50, 1446.00,
- 6. Levels S: 1165.25, 1147.75, 1122.50, 1102.50, 1088.50.
Daily Benchmarks
- (Short-Term) 5 Day: 1258.75 Up Trend,
- (Short-Term) 10 Day: 1243.00 Up Trend,
- (Intermediate-Term) 20 Day: 1211.75 Up Trend,
- (Intermediate-Term) 55 Day: 1205.50 Up Trend,
- (Long-Term) 100 Day: 1197.00 Up Trend,
- (Long-Term) 200 Day: 1181.50 Up Trend.
Additional Metrics
- ATR: 87.75,
- VOLMA: 155181.
Recent Trade Signals
- 31 Aug 2026: Long ZS 11-26 @ 1292.5 Signals.USAR-WSFG
Overall Rating
- Short-Term: Bullish,
- Intermediate-Term: Bullish,
- Long-Term: Bullish.
Key Insights Summary
ZS completed a sharp V-shaped recovery from the August low near 1165.25 and accelerated into a new pivot high at 1294.50. Price is extended above every daily benchmark, while all benchmark trends, pivot trends, monthly grid, and yearly grid remain aligned upward. The weekly grid remains below its F0% reference, creating a short-term counter-theme versus the stronger daily and higher-timeframe advance. Large bars and elevated ATR reflect fast momentum and expanding volatility following the breakout from the August consolidation range.
Chart Analysis ATS AI Generated: 2026-08-31 07:13 for Informational use only, not trading advice. Terms and Risk Disclosure Copyright © 2026. Algo Trading Systems LLC.