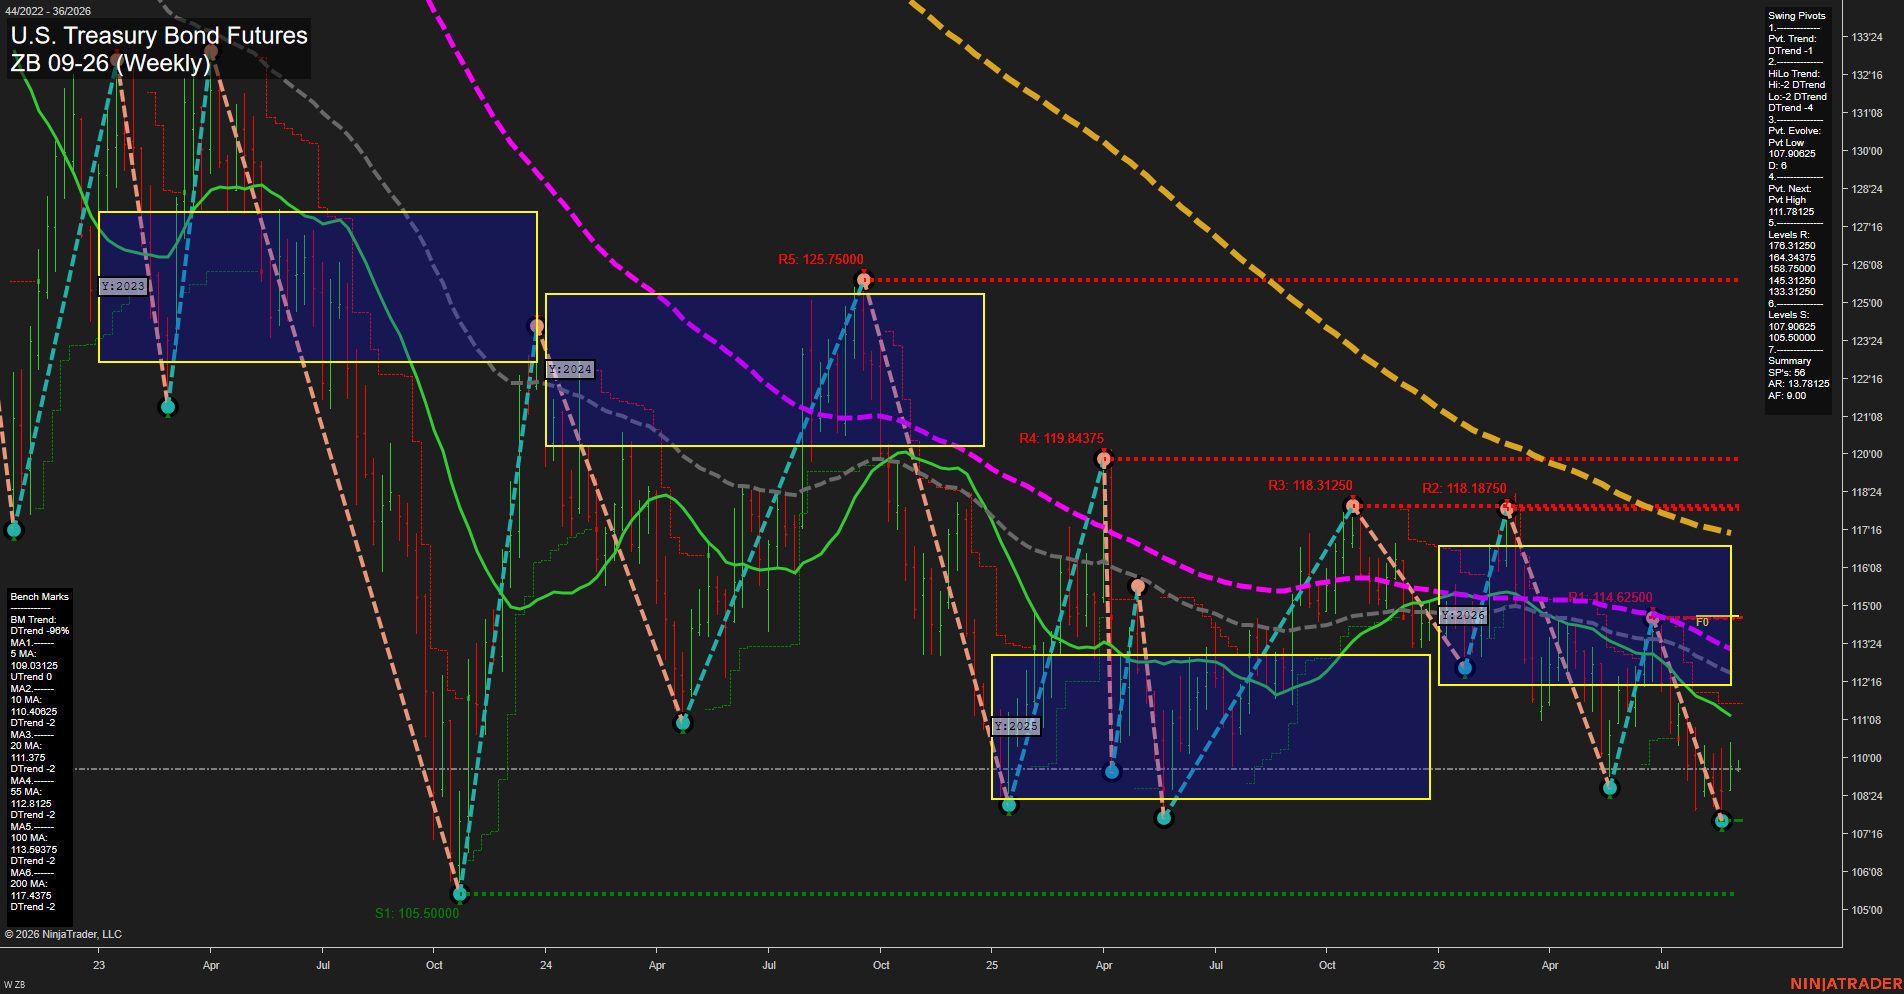
ZB U.S. Treasury Bond Futures Weekly Chart Analysis: 2026-Aug-31 07:12 CT
Price Action
- Last: 109-00,
- Bars: Small,
- Mom: Momentum slow.
WSFG Weekly
- Short-Term
- WSFG Current: NA%
- F0%/NTZ' Bias: Price Bearish,
- WSFG Trend: Bearish.
MSFG Month Aug
- Intermediate-Term
- MSFG Current: NA%
- F0%/NTZ' Bias: Price Bearish,
- MSFG Trend: Bearish.
YSFG Year 2026
- Long-Term
- YSFG Current: NA%
- F0%/NTZ' Bias: Price Bearish,
- YSFG Trend: Bearish.
Swing Pivots
- (Short-Term) 1. Pvt. Trend: DTrend,
- (Intermediate-Term) 2. HiLo Trend: DTrend,
- 3. Pvt. Evolve: Pvt low 107.90625,
- 4. Pvt. Next: Pvt high 111.78125,
- 5. Levels R: 176.31250, 164.34375, 158.75000, 145.31250, 133.31250,
- 6. Levels S: 107.90625, 105.50000.
Weekly Benchmarks
- (Short-Term) 5 Day: 109.3125 Up Trend,
- (Short-Term) 10 Day: 110.40625 Down Trend,
- (Intermediate-Term) 20 Day: 111.375 Down Trend,
- (Intermediate-Term) 55 Day: 112.8125 Down Trend,
- (Long-Term) 100 Day: 113.59375 Down Trend,
- (Long-Term) 200 Day: 117.4375 Down Trend.
Overall Rating
- Short-Term: Bearish,
- Intermediate-Term: Bearish,
- Long-Term: Bearish.
Key Insights Summary
Price is holding only marginally above the 107.90625 pivot low after a persistent weekly decline. The small bars and rising 5-day benchmark reflect slowing downside momentum and a modest basing bounce, but the active pivot structure remains DTrend and the next opposite pivot is not defined until 111.78125. Price remains below the 10-, 20-, 55-, 100-, and 200-day benchmarks, while the weekly, monthly, and yearly Fib-grid positioning is below F0% and the neutral zone. This preserves a broad lower-high/lower-low structure, with 107.90625 and 105.50000 defining the principal downside support area and 111.375 to 111.78125 representing the nearest overhead technical recovery zone.
Chart Analysis ATS AI Generated: 2026-08-31 07:12 for Informational use only, not trading advice. Terms and Risk Disclosure Copyright © 2026. Algo Trading Systems LLC.