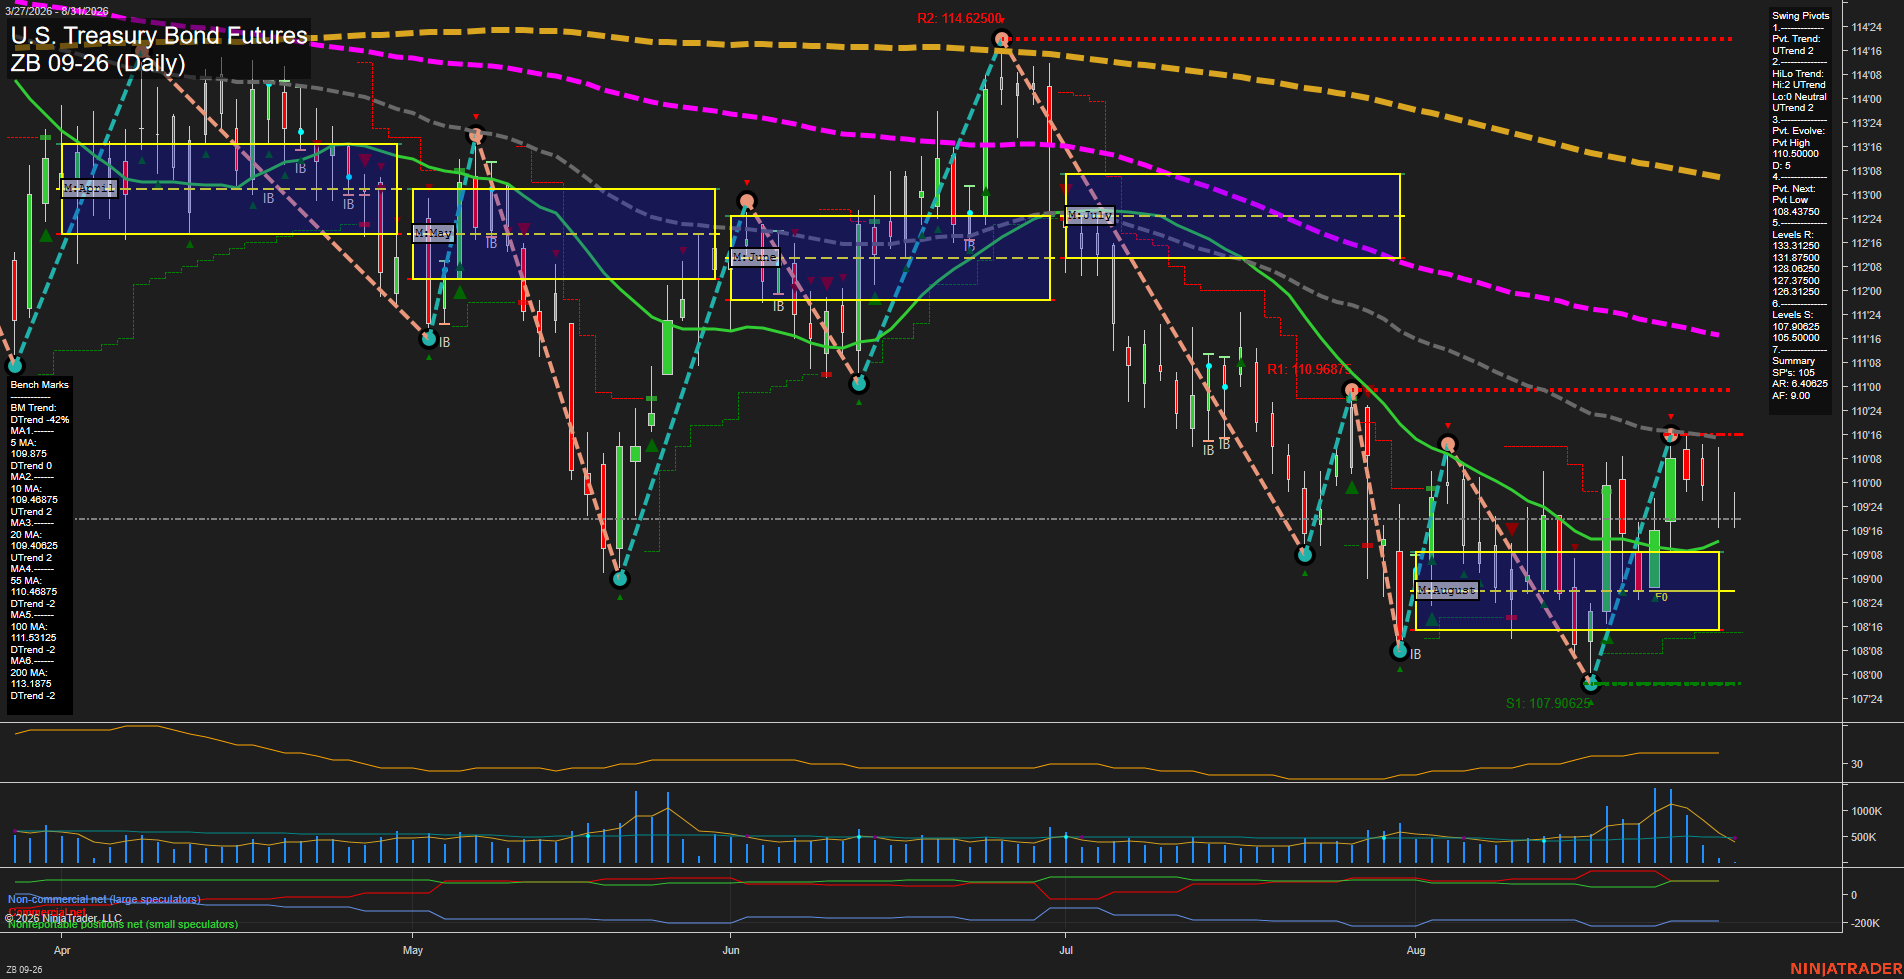
ZB U.S. Treasury Bond Futures Daily Chart Analysis: 2026-Aug-31 07:12 CT
Price Action
- Last: 109.17,
- Bars: Small,
- Mom: slow.
WSFG Weekly
- Short-Term
- WSFG Current: NA%
- F0%/NTZ' Bias: Price Neutral,
- WSFG Trend: Neutral.
MSFG Month Aug
- Intermediate-Term
- MSFG Current: 104%
- F0%/NTZ' Bias: Price Bullish,
- MSFG Trend: Bullish.
YSFG Year 2026
- Long-Term
- YSFG Current: NA%
- F0%/NTZ' Bias: Price Neutral,
- YSFG Trend: Neutral.
Swing Pivots
- (Short-Term) 1. Pvt. Trend: UTrend,
- (Intermediate-Term) 2. HiLo Trend: UTrend,
- 3. Pvt. Evolve: Pvt high 110.59375,
- 4. Pvt. Next: Pvt low 108.43750,
- 5. Levels R: 133.31250, 131.87500, 128.06250, 127.37500, 126.31250,
- 6. Levels S: 107.90625, 105.50000.
Daily Benchmarks
- (Short-Term) 5 Day: 109.87500 Down Trend,
- (Short-Term) 10 Day: 109.46875 Up Trend,
- (Intermediate-Term) 20 Day: 109.40625 Up Trend,
- (Intermediate-Term) 55 Day: 110.46875 Down Trend,
- (Long-Term) 100 Day: 112.31250 Down Trend,
- (Long-Term) 200 Day: 113.18750 Down Trend.
Additional Metrics
Overall Rating
- Short-Term: Bullish,
- Intermediate-Term: Neutral,
- Long-Term: Bearish.
Key Insights Summary
Price is consolidating near 109.17 after a rebound from the late-August 107.90625 swing low. The short-term pivot structure remains upward and price is above the August F0%/NTZ area, but the small daily bars and slow momentum reflect a compressed, choppy recovery phase. The 10-day and 20-day benchmarks are rising, while price remains beneath the declining 55-day, 100-day, and 200-day averages; this preserves a bearish long-term trend backdrop despite the short-term rebound. The 110.59375 pivot high remains the nearby structural upside reference, while 108.43750 is the pivot reversal level and 107.90625 is the major recent support.
Chart Analysis ATS AI Generated: 2026-08-31 07:12 for Informational use only, not trading advice. Terms and Risk Disclosure Copyright © 2026. Algo Trading Systems LLC.