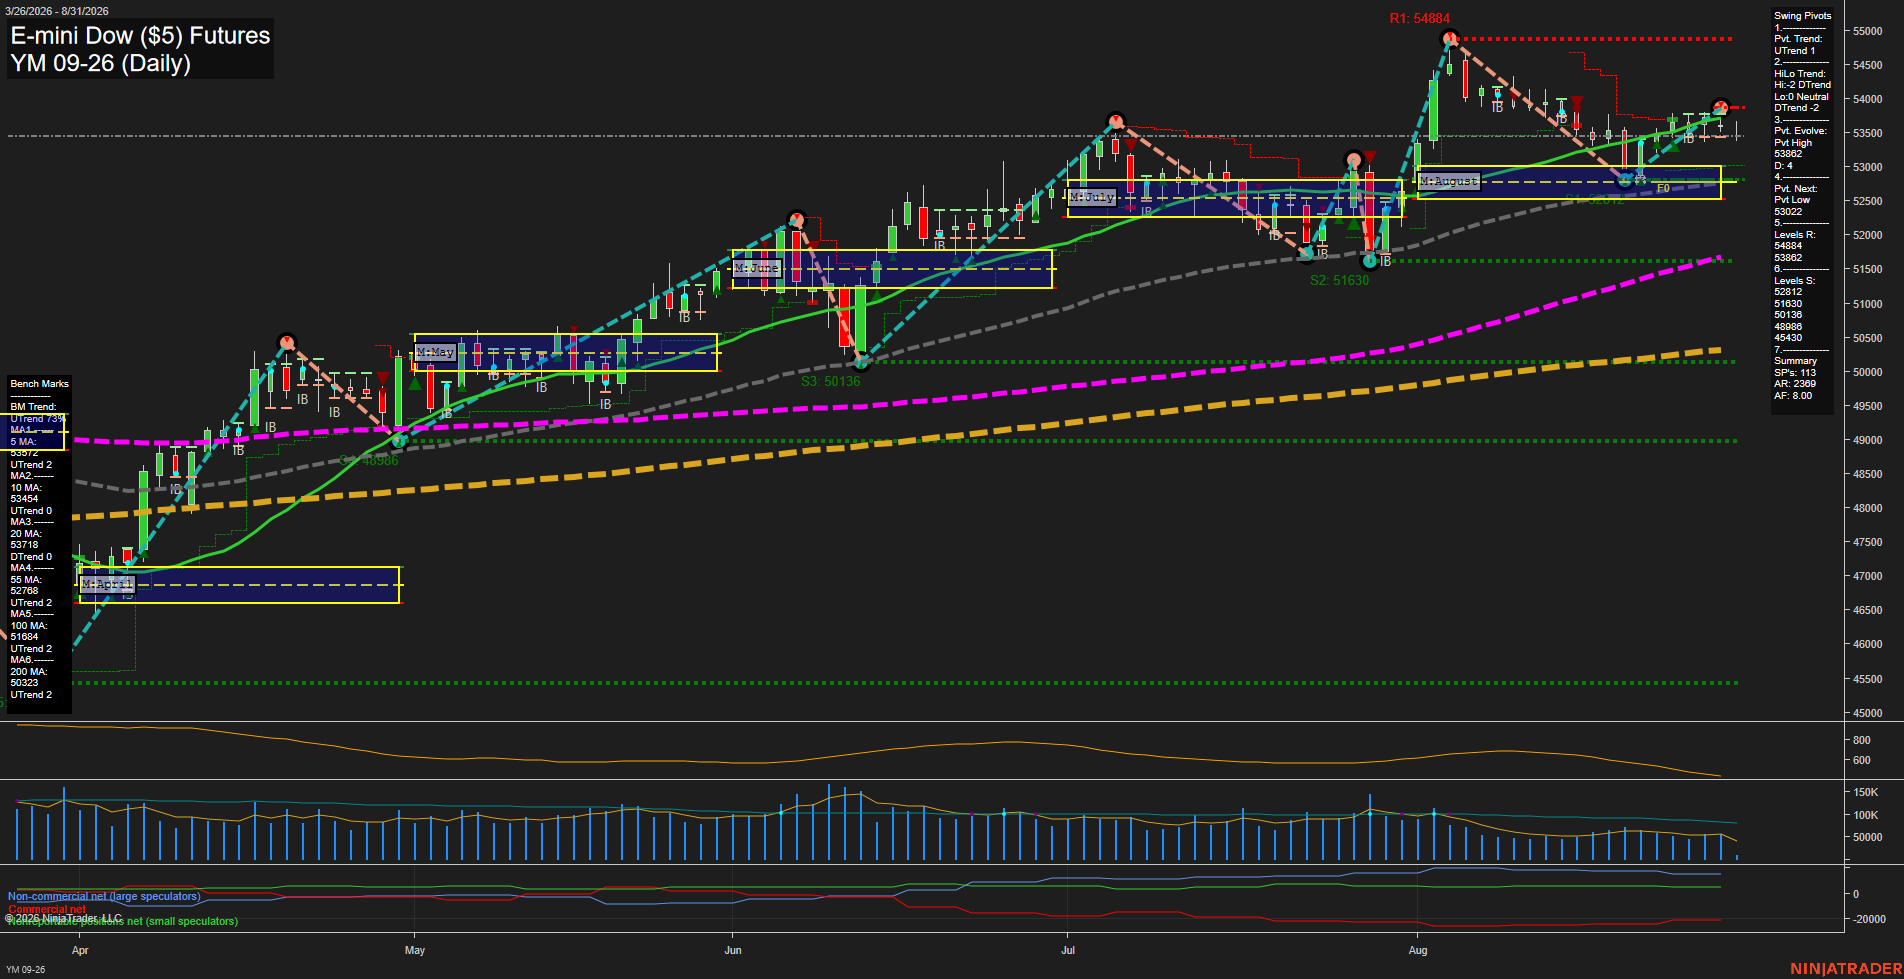
YM E-mini Dow ($5) Futures Daily Chart Analysis: 2026-Aug-31 07:11 CT
Price Action
- Last: 53882,
- Bars: Small,
- Mom: Slow.
WSFG Weekly
- Short-Term
- WSFG Current: -18%
- F0%/NTZ' Bias: Price Below,
- WSFG Trend: Down.
MSFG Month Aug
- Intermediate-Term
- MSFG Current: 29%
- F0%/NTZ' Bias: Price Above,
- MSFG Trend: Up.
YSFG Year 2026
- Long-Term
- YSFG Current: 53%
- F0%/NTZ' Bias: Price Above,
- YSFG Trend: Up.
Swing Pivots
- (Short-Term) 1. Pvt. Trend: UTrend,
- (Intermediate-Term) 2. HiLo Trend: DTrend,
- 3. Pvt. Evolve: Pvt high 53882,
- 4. Pvt. Next: Pvt low 53022,
- 5. Levels R: 54884, 53882,
- 6. Levels S: 52812, 51630, 50136, 48986, 45430.
Daily Benchmarks
- (Short-Term) 5 Day: 53882 Up Trend,
- (Short-Term) 10 Day: 53454 Up Trend,
- (Intermediate-Term) 20 Day: 53710 Down Trend,
- (Intermediate-Term) 55 Day: 52768 Up Trend,
- (Long-Term) 100 Day: 51689 Up Trend,
- (Long-Term) 200 Day: 50323 Up Trend.
Additional Metrics
Recent Trade Signals
- 31 Aug 2026: Short YM 09-26 @ 53450 Signals.USAR-WSFG
Overall Rating
- Short-Term: Neutral,
- Intermediate-Term: Neutral,
- Long-Term: Bullish.
Key Insights Summary
YM recovered from the 52812 swing-low area and is holding above the rising 10-day, 55-day, 100-day, and 200-day benchmarks, preserving the broader bullish structure. Short-term action is compressed near 53882 after a rebound, with small bars and slow momentum reflecting consolidation beneath 54884 resistance. The weekly fib condition remains down and the intermediate HiLo pivot trend remains down, while the monthly and yearly grids remain positive; this creates a mixed countertrend environment within the larger advance. The 53022 pivot-next level and 52812 support define the recent pullback structure, while a sustained move through the 53882 pivot-high area would refocus attention on 54884 resistance.
Chart Analysis ATS AI Generated: 2026-08-31 07:11 for Informational use only, not trading advice. Terms and Risk Disclosure Copyright © 2026. Algo Trading Systems LLC.