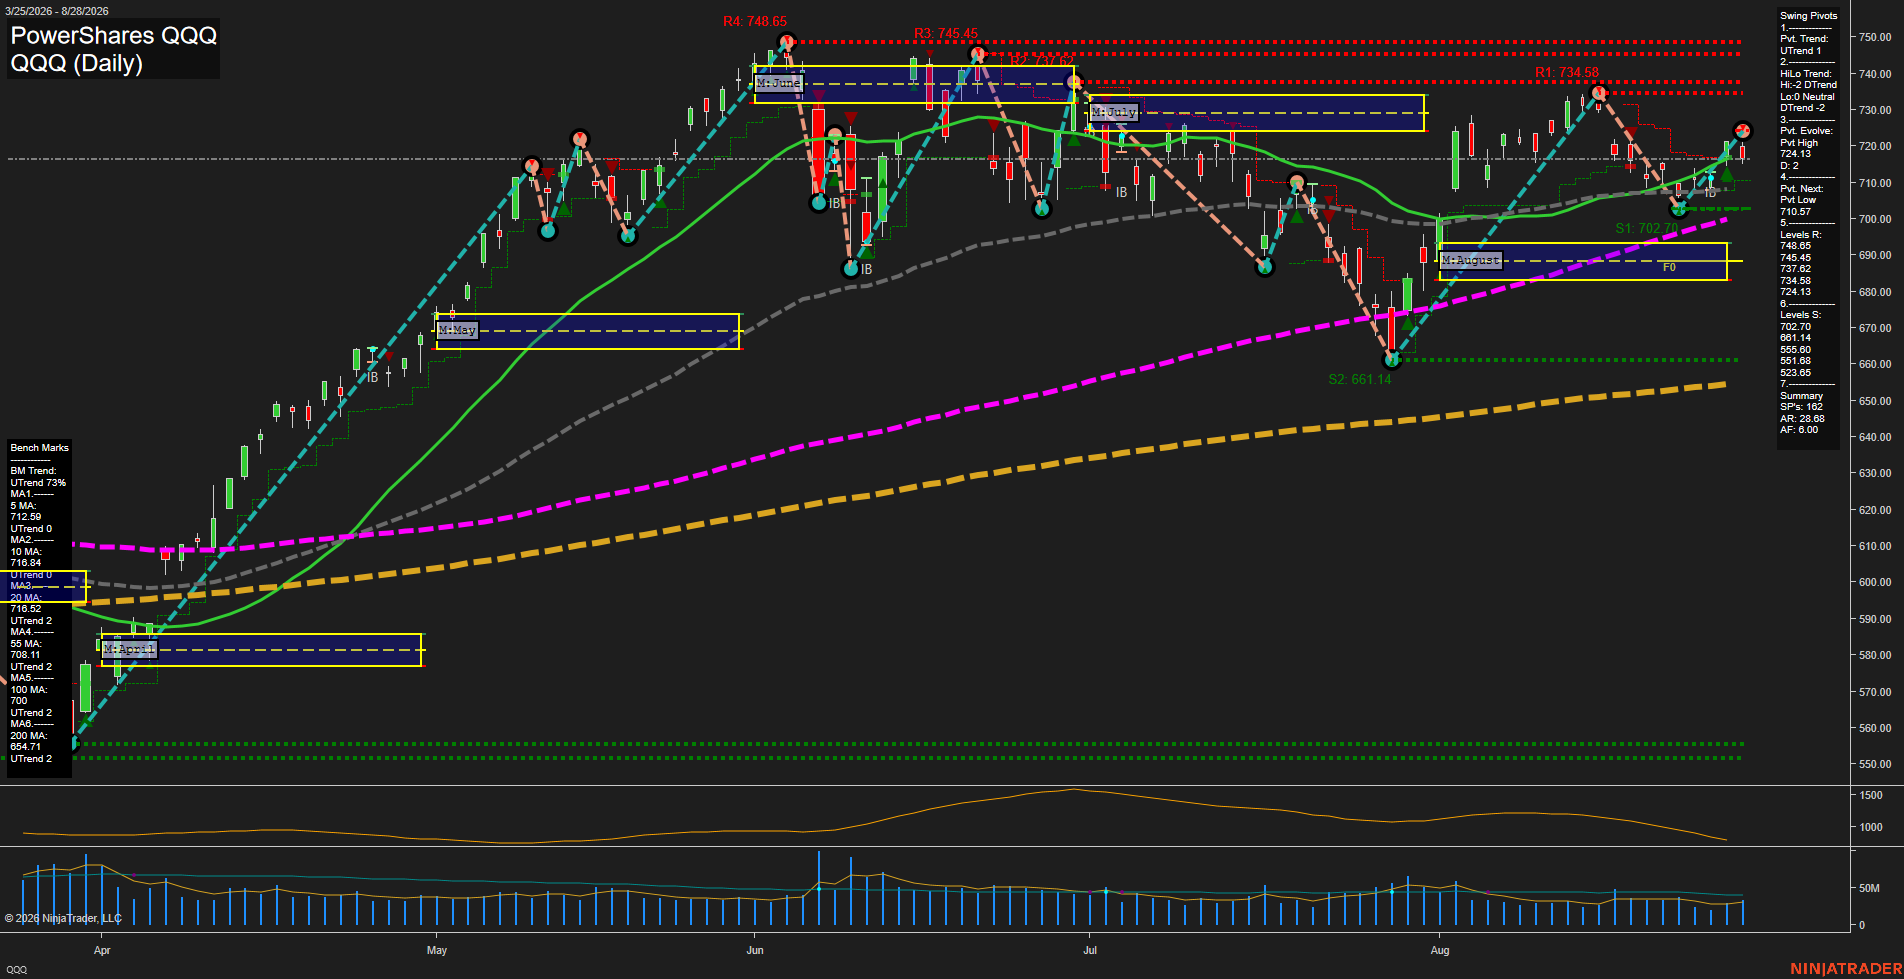
QQQ PowerShares QQQ Daily Chart Analysis: 2026-Aug-31 07:08 CT
Price Action
- Last: 724.13,
- Bars: Medium,
- Mom: Fast.
WSFG Weekly
- Short-Term
- WSFG Current: NA%
- F0%/NTZ' Bias: Price Neutral,
- WSFG Trend: Neutral.
MSFG Month Aug
- Intermediate-Term
- MSFG Current: NA%
- F0%/NTZ' Bias: Price Above NTZ,
- MSFG Trend: Bullish.
YSFG Year 2026
- Long-Term
- YSFG Current: NA%
- F0%/NTZ' Bias: Price Neutral,
- YSFG Trend: Neutral.
Swing Pivots
- (Short-Term) 1. Pvt. Trend: UTrend,
- (Intermediate-Term) 2. HiLo Trend: DTrend,
- 3. Pvt. Evolve: Pvt high 724.13,
- 4. Pvt. Next: Pvt low 701.57,
- 5. Levels R: 748.65, 745.45, 737.62, 734.58, 724.13,
- 6. Levels S: 702.70, 681.14, 655.60, 551.68, 523.65.
Daily Benchmarks
- (Short-Term) 5 Day: 712.59 Up Trend,
- (Short-Term) 10 Day: 716.84 Up Trend,
- (Intermediate-Term) 20 Day: 718.52 Up Trend,
- (Intermediate-Term) 55 Day: 708.11 Up Trend,
- (Long-Term) 100 Day: 700.02 Up Trend,
- (Long-Term) 200 Day: 654.71 Up Trend.
Additional Metrics
- ATR: 28.68,
- VOLMA: 32709273.
Overall Rating
- Short-Term: Bullish,
- Intermediate-Term: Neutral,
- Long-Term: Bullish.
Key Insights Summary
QQQ has rebounded sharply from the early-August 661.14 swing low and is now holding above all six rising daily benchmarks. Short-term pivot structure is upward, with the latest advance pressing the 724.13 pivot-high area; however, the intermediate HiLo structure remains in a DTrend following the prior lower-high sequence. The monthly grid is decisively below price, while 734.58 through 748.65 forms a layered overhead resistance band. Futures-style swing conditions are characterized by fast upside momentum, medium daily ranges, declining ATR from the July peak, and relatively subdued volume participation versus the earlier August recovery.
Chart Analysis ATS AI Generated: 2026-08-31 07:08 for Informational use only, not trading advice. Terms and Risk Disclosure Copyright © 2026. Algo Trading Systems LLC.