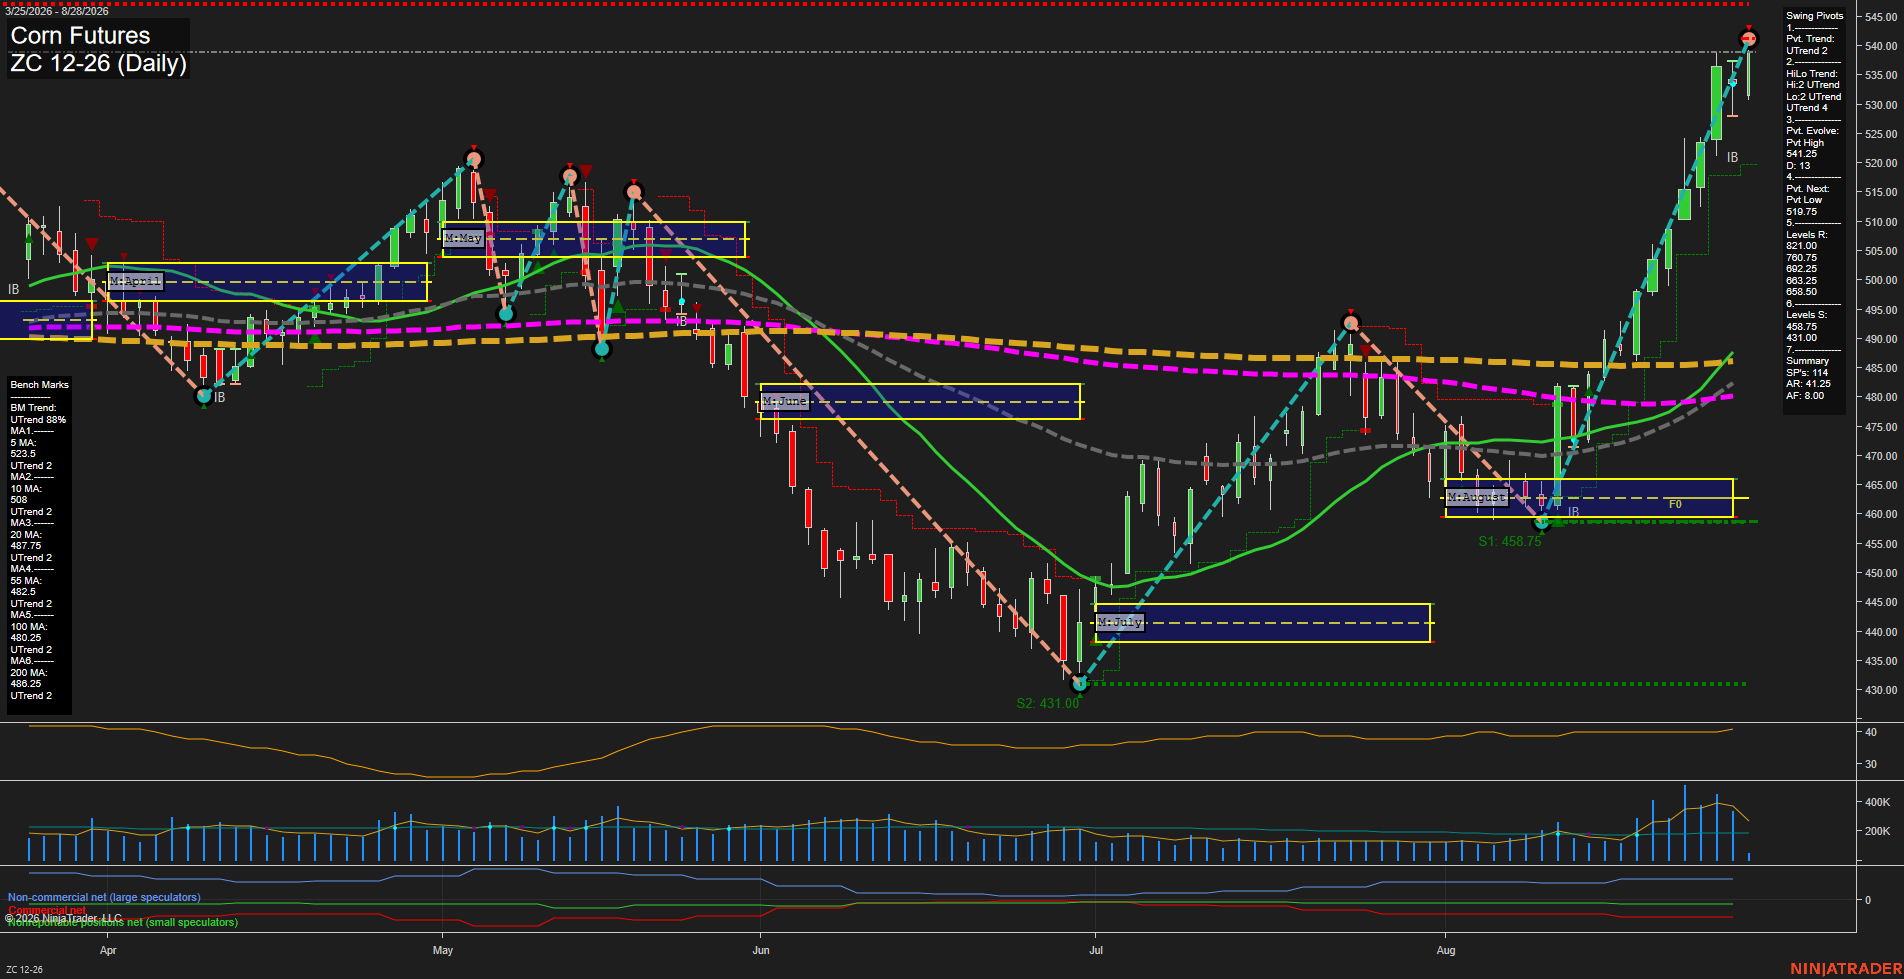
ZC Corn Futures Daily Chart Analysis: 2026-Aug-28 07:12 CT
Price Action
- Last: 541.25,
- Bars: Large,
- Mom: fast.
WSFG Weekly
- Short-Term
- WSFG Current: 121%
- F0%/NTZ' Bias: Price Above,
- WSFG Trend: Up.
MSFG Month Aug
- Intermediate-Term
- MSFG Current: 198%
- F0%/NTZ' Bias: Price Above,
- MSFG Trend: Up.
YSFG Year 2026
- Long-Term
- YSFG Current: 24%
- F0%/NTZ' Bias: Price Above,
- YSFG Trend: Up.
Swing Pivots
- (Short-Term) 1. Pvt. Trend: UTrend,
- (Intermediate-Term) 2. HiLo Trend: UTrend,
- 3. Pvt. Evolve: Pvt high 541.25,
- 4. Pvt. Next: Pvt low 519.75,
- 5. Levels R: 521.00, 500.75, 492.25, 483.25, 458.50,
- 6. Levels S: 431.00.
Daily Benchmarks
- (Short-Term) 5 Day: 534.50 Up Trend,
- (Short-Term) 10 Day: 508.00 Up Trend,
- (Intermediate-Term) 20 Day: 487.75 Up Trend,
- (Intermediate-Term) 55 Day: 482.50 Up Trend,
- (Long-Term) 100 Day: 480.25 Up Trend,
- (Long-Term) 200 Day: 486.25 Up Trend.
Additional Metrics
- ATR: 41.25,
- VOLMA: 252019.
Overall Rating
- Short-Term: Bullish,
- Intermediate-Term: Bullish,
- Long-Term: Bullish.
Key Insights Summary
Corn futures show a broad-based upside expansion, with large daily bars, fast momentum, price above the weekly and monthly Fib grids, and all benchmark averages aligned in rising trends. The pivot structure remains UTrend across short- and intermediate-term measures, progressing from the August low near 458.75 through a sequence of higher lows and higher highs to 541.25. Price is extended above the 5-day and 10-day averages following a high-volume advance, while 519.75 defines the next short-term pivot reversal threshold. The prior resistance levels at 521.00, 500.75, and 492.25 have shifted into notable underlying reference zones beneath the current rally.
Chart Analysis ATS AI Generated: 2026-08-28 07:12 for Informational use only, not trading advice. Terms and Risk Disclosure Copyright © 2026. Algo Trading Systems LLC.