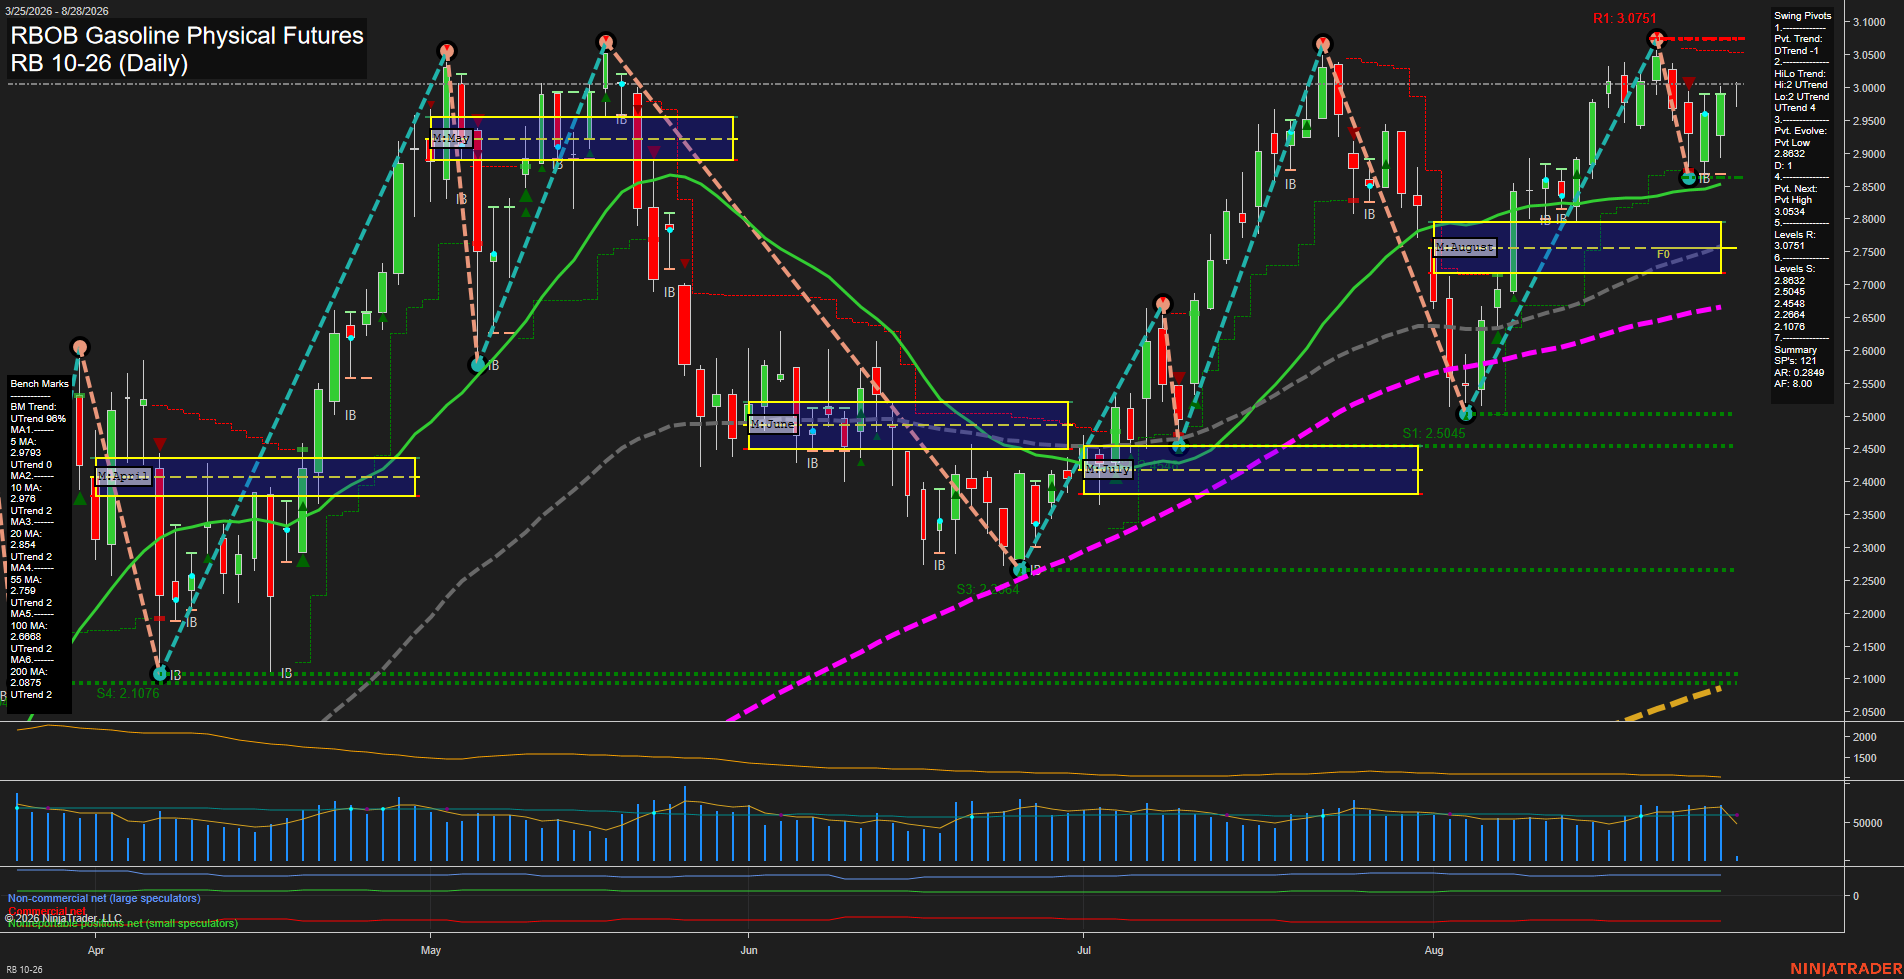
RB RBOB Gasoline Physical Futures Daily Chart Analysis: 2026-Aug-28 07:08 CT
Price Action
- Last: 3.0030,
- Bars: Medium,
- Mom: Average.
WSFG Weekly
- Short-Term
- WSFG Current: -6%
- F0%/NTZ' Bias: Price Below,
- WSFG Trend: Down.
MSFG Month Aug
- Intermediate-Term
- MSFG Current: 55%
- F0%/NTZ' Bias: Price Above,
- MSFG Trend: Up.
YSFG Year 2026
- Long-Term
- YSFG Current: 187%
- F0%/NTZ' Bias: Price Above,
- YSFG Trend: Up.
Swing Pivots
- (Short-Term) 1. Pvt. Trend: DTrend,
- (Intermediate-Term) 2. HiLo Trend: UTrend,
- 3. Pvt. Evolve: Pvt low 2.8670,
- 4. Pvt. Next: Pvt high 3.0534,
- 5. Levels R: 3.0751,
- 6. Levels S: 2.8502, 2.5045, 2.4548, 2.2868, 2.1076.
Daily Benchmarks
- (Short-Term) 5 Day: 2.9703 Up Trend,
- (Short-Term) 10 Day: 2.9760 Up Trend,
- (Intermediate-Term) 20 Day: 2.8549 Up Trend,
- (Intermediate-Term) 55 Day: 2.7590 Up Trend,
- (Long-Term) 100 Day: 2.6880 Up Trend,
- (Long-Term) 200 Day: 2.0875 Up Trend.
Additional Metrics
Recent Trade Signals
- 26 Aug 2026: Long RB 10-26 @ 2.9775 Signals.USAR.TR120
- 25 Aug 2026: Short RB 10-26 @ 2.9833 Signals.USAR-WSFG
Overall Rating
- Short-Term: Bearish,
- Intermediate-Term: Bullish,
- Long-Term: Bullish.
Key Insights Summary
Price is holding above all major daily benchmarks and remains above the August monthly F0% area, preserving the broader intermediate and long-term recovery structure. The short-term swing structure is mixed-to-bearish: the active pivot trend is down and the weekly grid is below F0%, following a rejection from the 3.05-3.08 resistance zone. The late-August rebound from the 2.867 pivot low has restored price near 3.00, but 3.0534 is the key pivot reversal level and 3.0751 is the next major resistance. Support is concentrated at 2.8502, with substantially deeper structure at the monthly grid and rising moving-average zones near 2.50-2.76.
Chart Analysis ATS AI Generated: 2026-08-28 07:08 for Informational use only, not trading advice. Terms and Risk Disclosure Copyright © 2026. Algo Trading Systems LLC.