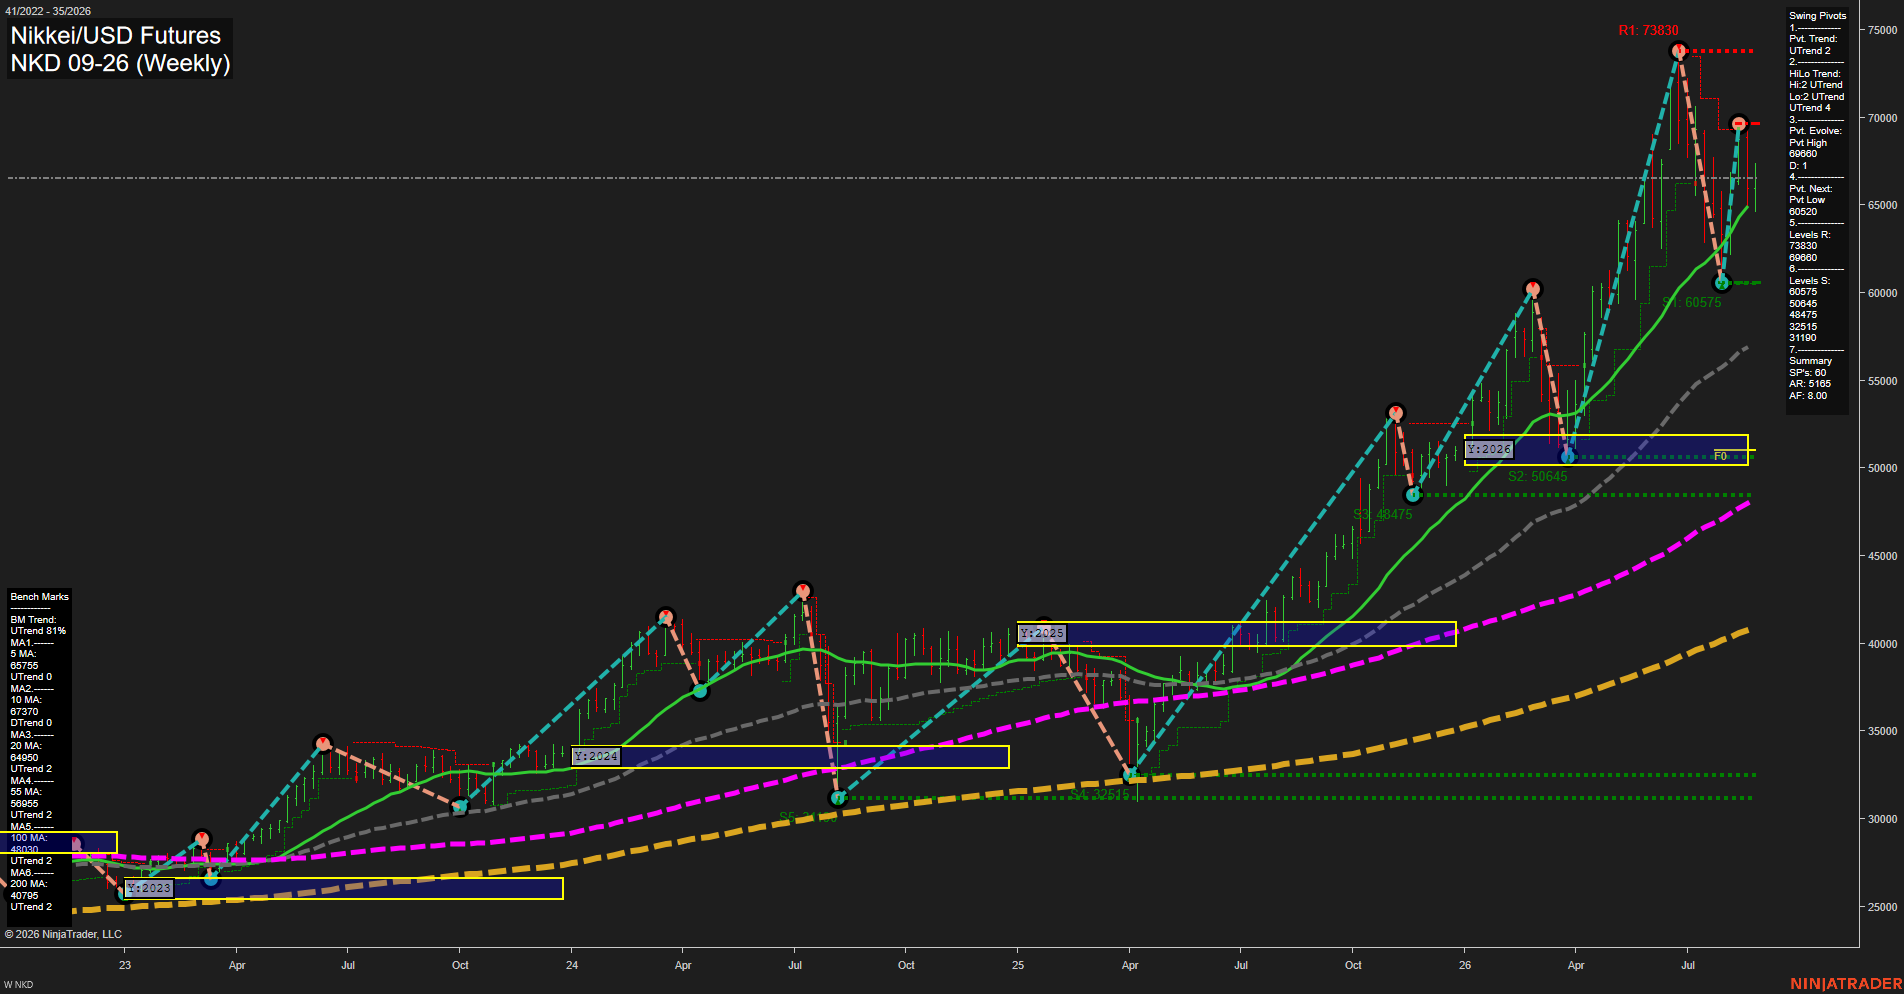
NKD Nikkei/USD Futures Weekly Chart Analysis: 2026-Aug-28 07:07 CT
Price Action
- Last: 66495,
- Bars: Large,
- Mom: fast.
WSFG Weekly
- Short-Term
- WSFG Current: 14%
- F0%/NTZ' Bias: Price Above,
- WSFG Trend: Up.
MSFG Month Aug
- Intermediate-Term
- MSFG Current: 37%
- F0%/NTZ' Bias: Price Above,
- MSFG Trend: Up.
YSFG Year 2026
- Long-Term
- YSFG Current: 186%
- F0%/NTZ' Bias: Price Above,
- YSFG Trend: Up.
Swing Pivots
- (Short-Term) 1. Pvt. Trend: UTrend,
- (Intermediate-Term) 2. HiLo Trend: UTrend,
- 3. Pvt. Evolve: Pvt high 69860,
- 4. Pvt. Next: Pvt low 60520,
- 5. Levels R: 73830, 69600,
- 6. Levels S: 60575, 50845, 48475, 32515, 31190.
Weekly Benchmarks
- (Short-Term) 5 Day: 65755 Up Trend,
- (Short-Term) 10 Day: 67370 Down Trend,
- (Intermediate-Term) 20 Day: 64950 Up Trend,
- (Intermediate-Term) 55 Day: 56955 Up Trend,
- (Long-Term) 100 Day: 48030 Up Trend,
- (Long-Term) 200 Day: 40780 Up Trend.
Recent Trade Signals
- 26 Aug 2026: Short NKD 09-26 @ 65405 Signals.USAR-WSFG
Overall Rating
- Short-Term: Bullish,
- Intermediate-Term: Bullish,
- Long-Term: Bullish.
Key Insights Summary
NKD retains a broad higher-high and higher-low weekly structure, with price above the rising 20, 55, 100, and 200-period benchmarks and above all three session-grid F0% levels. The latest large-range swing reflects fast momentum and elevated volatility after rejection from the evolving 69860 pivot high. The 69600 pivot resistance remains the immediate overhead reference, while 60575 is the key confirmed swing support. The recent WSFG short signal reflects a short-term countertrend pullback within an otherwise firmly advancing intermediate- and long-term trend structure.
Chart Analysis ATS AI Generated: 2026-08-28 07:07 for Informational use only, not trading advice. Terms and Risk Disclosure Copyright © 2026. Algo Trading Systems LLC.