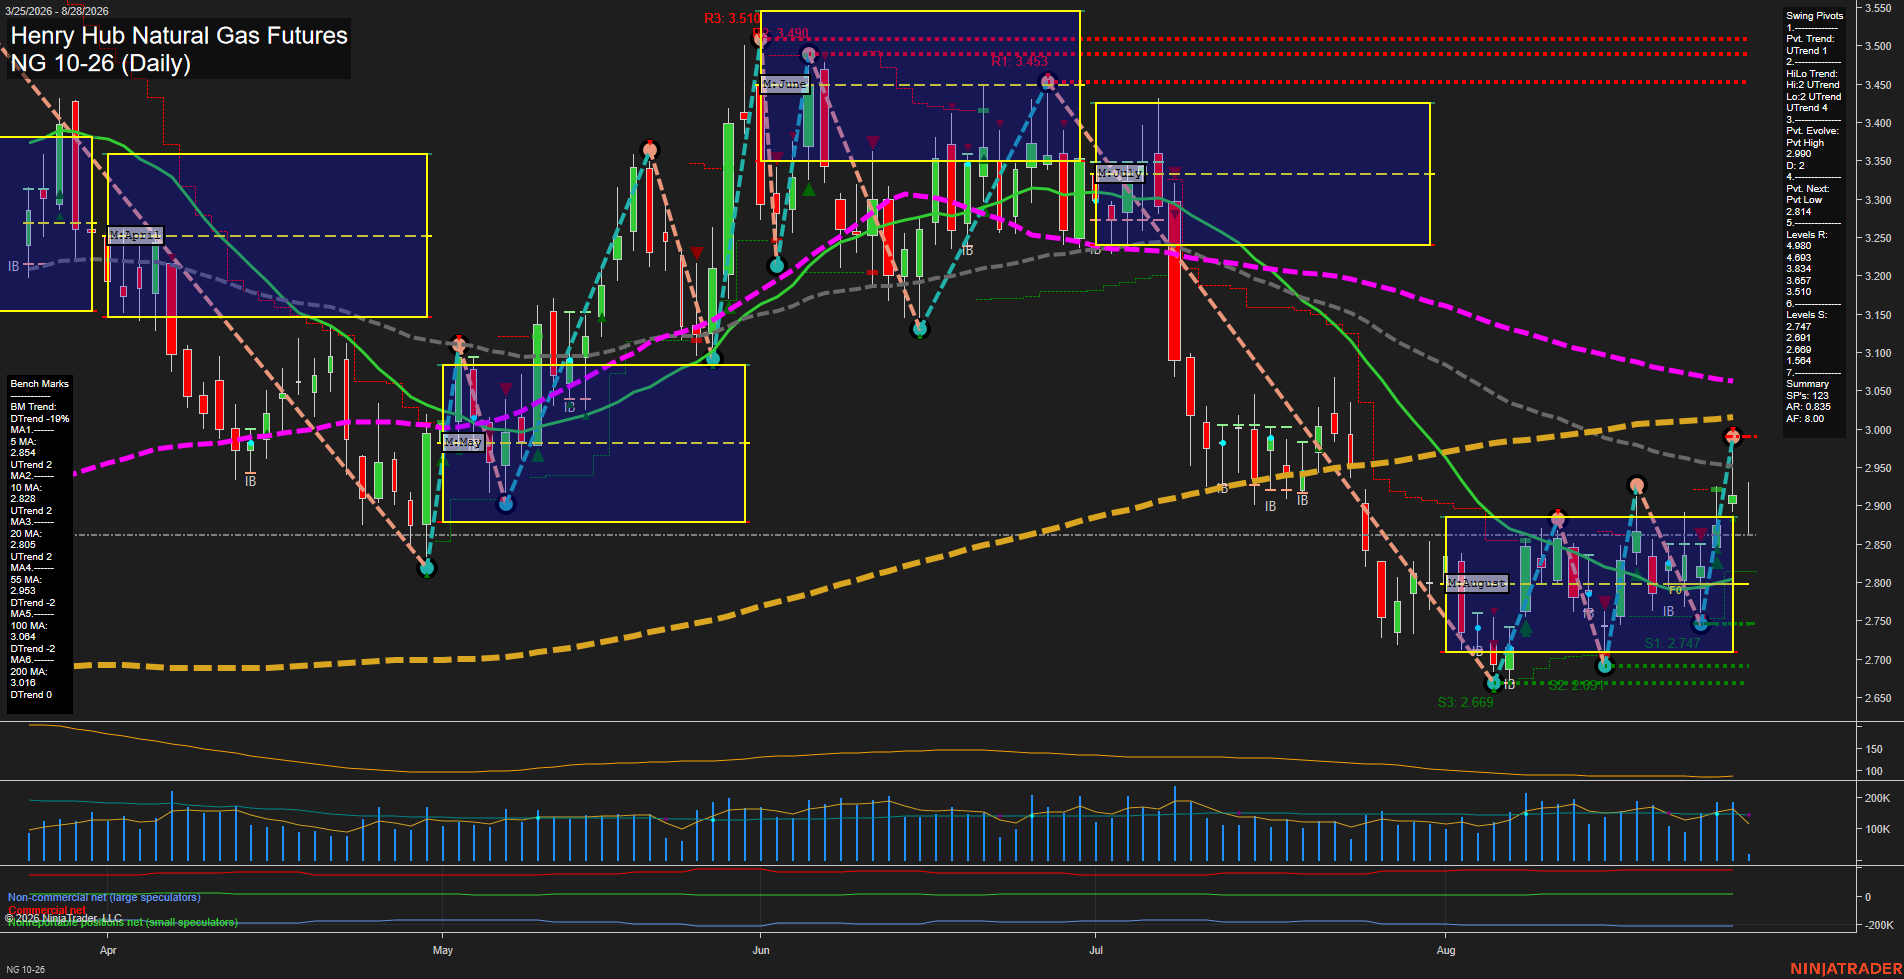
NG Henry Hub Natural Gas Futures Daily Chart Analysis: 2026-Aug-28 07:06 CT
Price Action
- Last: 2.835,
- Bars: Small,
- Mom: Slow.
WSFG Weekly
- Short-Term
- WSFG Current: 35%
- F0%/NTZ' Bias: Price Above,
- WSFG Trend: Up.
MSFG Month Aug
- Intermediate-Term
- MSFG Current: 14%
- F0%/NTZ' Bias: Price Above,
- MSFG Trend: Up.
YSFG Year 2026
- Long-Term
- YSFG Current: 13%
- F0%/NTZ' Bias: Price Above,
- YSFG Trend: Up.
Swing Pivots
- (Short-Term) 1. Pvt. Trend: DTrend,
- (Intermediate-Term) 2. HiLo Trend: UTrend,
- 3. Pvt. Evolve: Pvt high 2.90,
- 4. Pvt. Next: Pvt low 2.814,
- 5. Levels R: 4.899, 4.693, 3.834, 3.510,
- 6. Levels S: 2.747, 2.691, 2.689, 1.764.
Daily Benchmarks
- (Short-Term) 5 Day: 2.854 Up Trend,
- (Short-Term) 10 Day: 2.828 Up Trend,
- (Intermediate-Term) 20 Day: 2.809 Up Trend,
- (Intermediate-Term) 55 Day: 2.953 Down Trend,
- (Long-Term) 100 Day: 3.064 Down Trend,
- (Long-Term) 200 Day: 3.016 Down Trend.
Additional Metrics
Recent Trade Signals
- 28 Aug 2026: Short NG 10-26 @ 2.863 Signals.USAR.TR120
- 27 Aug 2026: Long NG 10-26 @ 2.906 Signals.USAR-MSFG
Overall Rating
- Short-Term: Neutral,
- Intermediate-Term: Bullish,
- Long-Term: Bearish.
Key Insights Summary
Natural gas is consolidating in a narrow August range after the sharp July-to-August decline, with small bars and slow momentum reflecting reduced directional conviction. Price remains above the rising 10-day and 20-day benchmarks and holds above the monthly and weekly Fib-grid centers, supporting the intermediate higher-low structure. The short-term pivot trend remains down, however, and price is below the 5-day average with nearby pivot resistance at 2.90. The broader swing structure remains capped beneath declining 55-day, 100-day, and 200-day benchmarks, leaving the longer-term trend bearish despite the current retracement bounce.
Chart Analysis ATS AI Generated: 2026-08-28 07:07 for Informational use only, not trading advice. Terms and Risk Disclosure Copyright © 2026. Algo Trading Systems LLC.