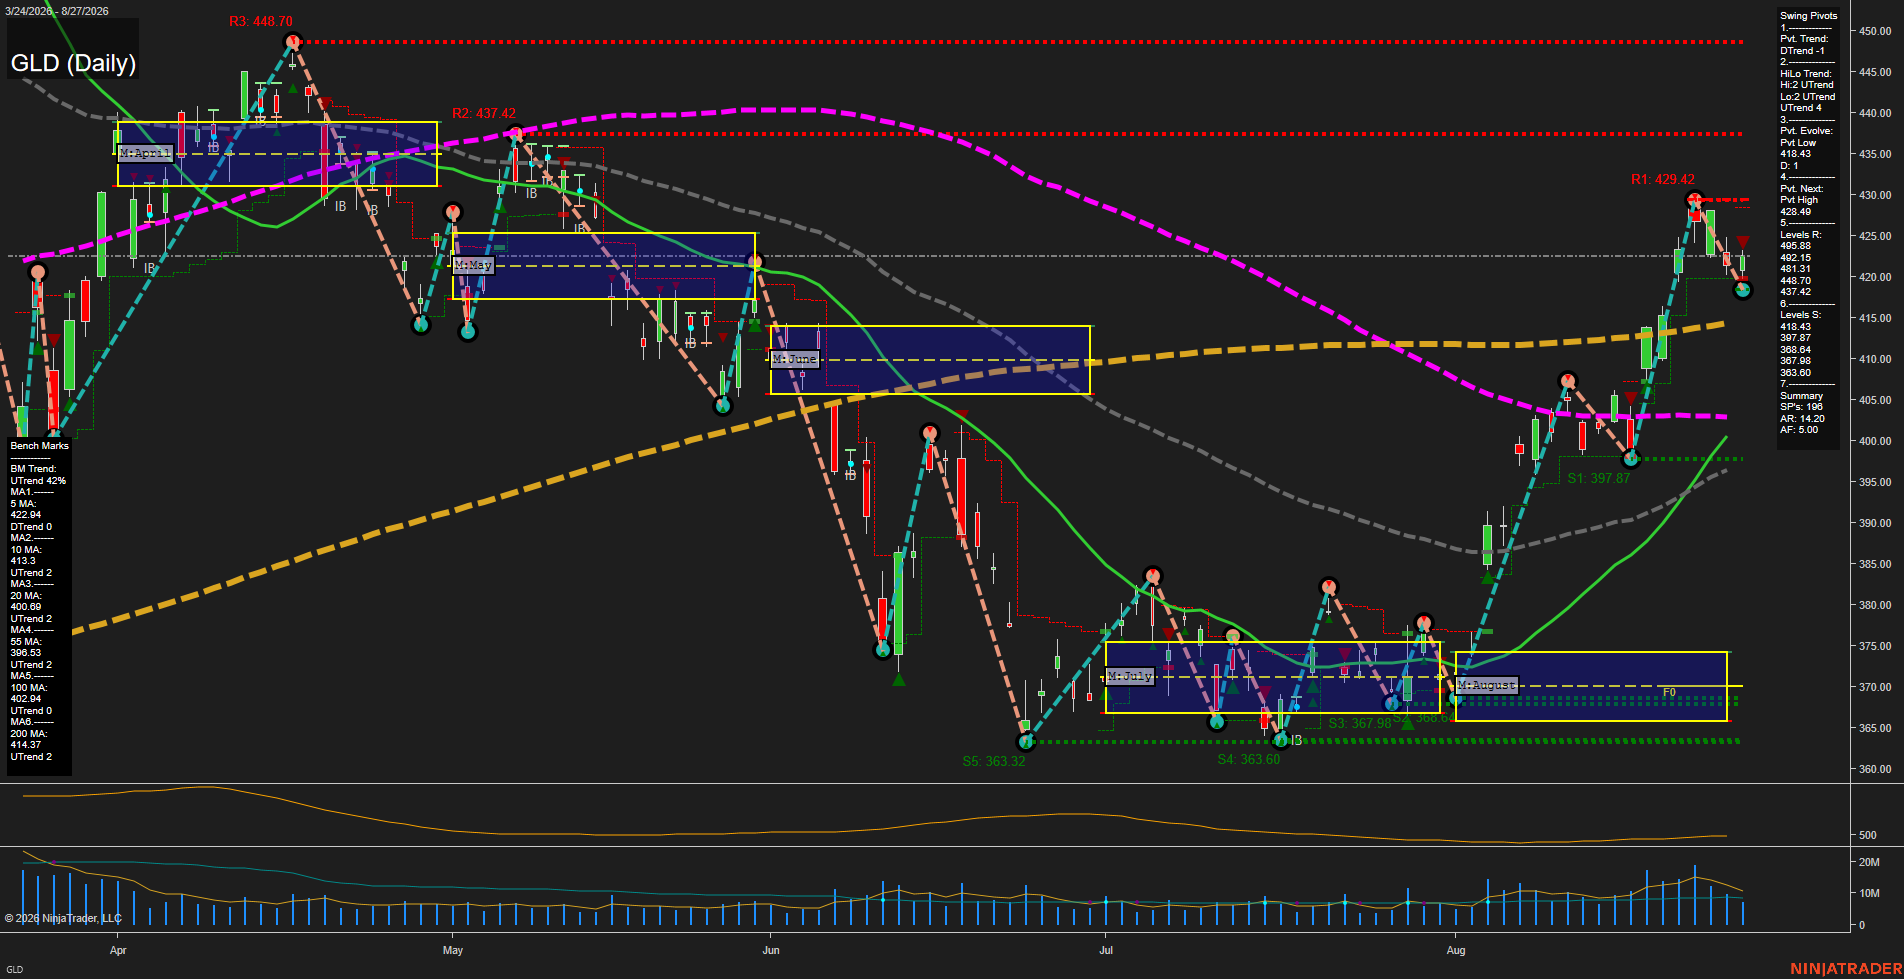
GLD SPDR Gold Shares Daily Chart Analysis: 2026-Aug-28 07:06 CT
Price Action
- Last: 418.70,
- Bars: Medium,
- Mom: fast.
WSFG Weekly
- Short-Term
- WSFG Current: NA%
- F0%/NTZ' Bias: Price Neutral,
- WSFG Trend: Neutral.
MSFG Month Aug
- Intermediate-Term
- MSFG Current: 100%
- F0%/NTZ' Bias: Price Above NTZ,
- MSFG Trend: Bullish.
YSFG Year 2026
- Long-Term
- YSFG Current: NA%
- F0%/NTZ' Bias: Price Neutral,
- YSFG Trend: Neutral.
Swing Pivots
- (Short-Term) 1. Pvt. Trend: DTrend,
- (Intermediate-Term) 2. HiLo Trend: UTrend,
- 3. Pvt. Evolve: Pvt low 418.70,
- 4. Pvt. Next: Pvt high 428.92,
- 5. Levels R: 495.88, 492.15, 481.31, 448.70, 437.42,
- 6. Levels S: 418.43, 397.87, 368.64, 367.98, 363.80.
Daily Benchmarks
- (Short-Term) 5 Day: 422.94 Down Trend,
- (Short-Term) 10 Day: 413.30 Up Trend,
- (Intermediate-Term) 20 Day: 406.80 Up Trend,
- (Intermediate-Term) 55 Day: 396.53 Up Trend,
- (Long-Term) 100 Day: 402.94 Up Trend,
- (Long-Term) 200 Day: 414.37 Up Trend.
Additional Metrics
- ATR: 142.0,
- VOLMA: 7207880.
Overall Rating
- Short-Term: Neutral,
- Intermediate-Term: Bullish,
- Long-Term: Bullish.
Key Insights Summary
GLD reflects a futures-style momentum retracement following the sharp August advance from the 368-370 consolidation area into the 429.42 swing high. The short-term pivot has shifted to DTrend as price retraces beneath the falling 5-day benchmark, while the intermediate HiLo structure remains UTrend and price holds above the rising 10-, 20-, 55-, 100-, and 200-day benchmarks. The 418.43 pivot support is being tested, with 397.87 as the next major structural support. A recovery through the 428.92 pivot-next level would re-establish the recent upside swing sequence, while 437.42 and 448.70 define higher resistance. The August MSFG remains far below current price, showing that the broader rally has materially extended beyond the monthly balance zone despite the current fast corrective momentum.
Chart Analysis ATS AI Generated: 2026-08-28 07:06 for Informational use only, not trading advice. Terms and Risk Disclosure Copyright © 2026. Algo Trading Systems LLC.