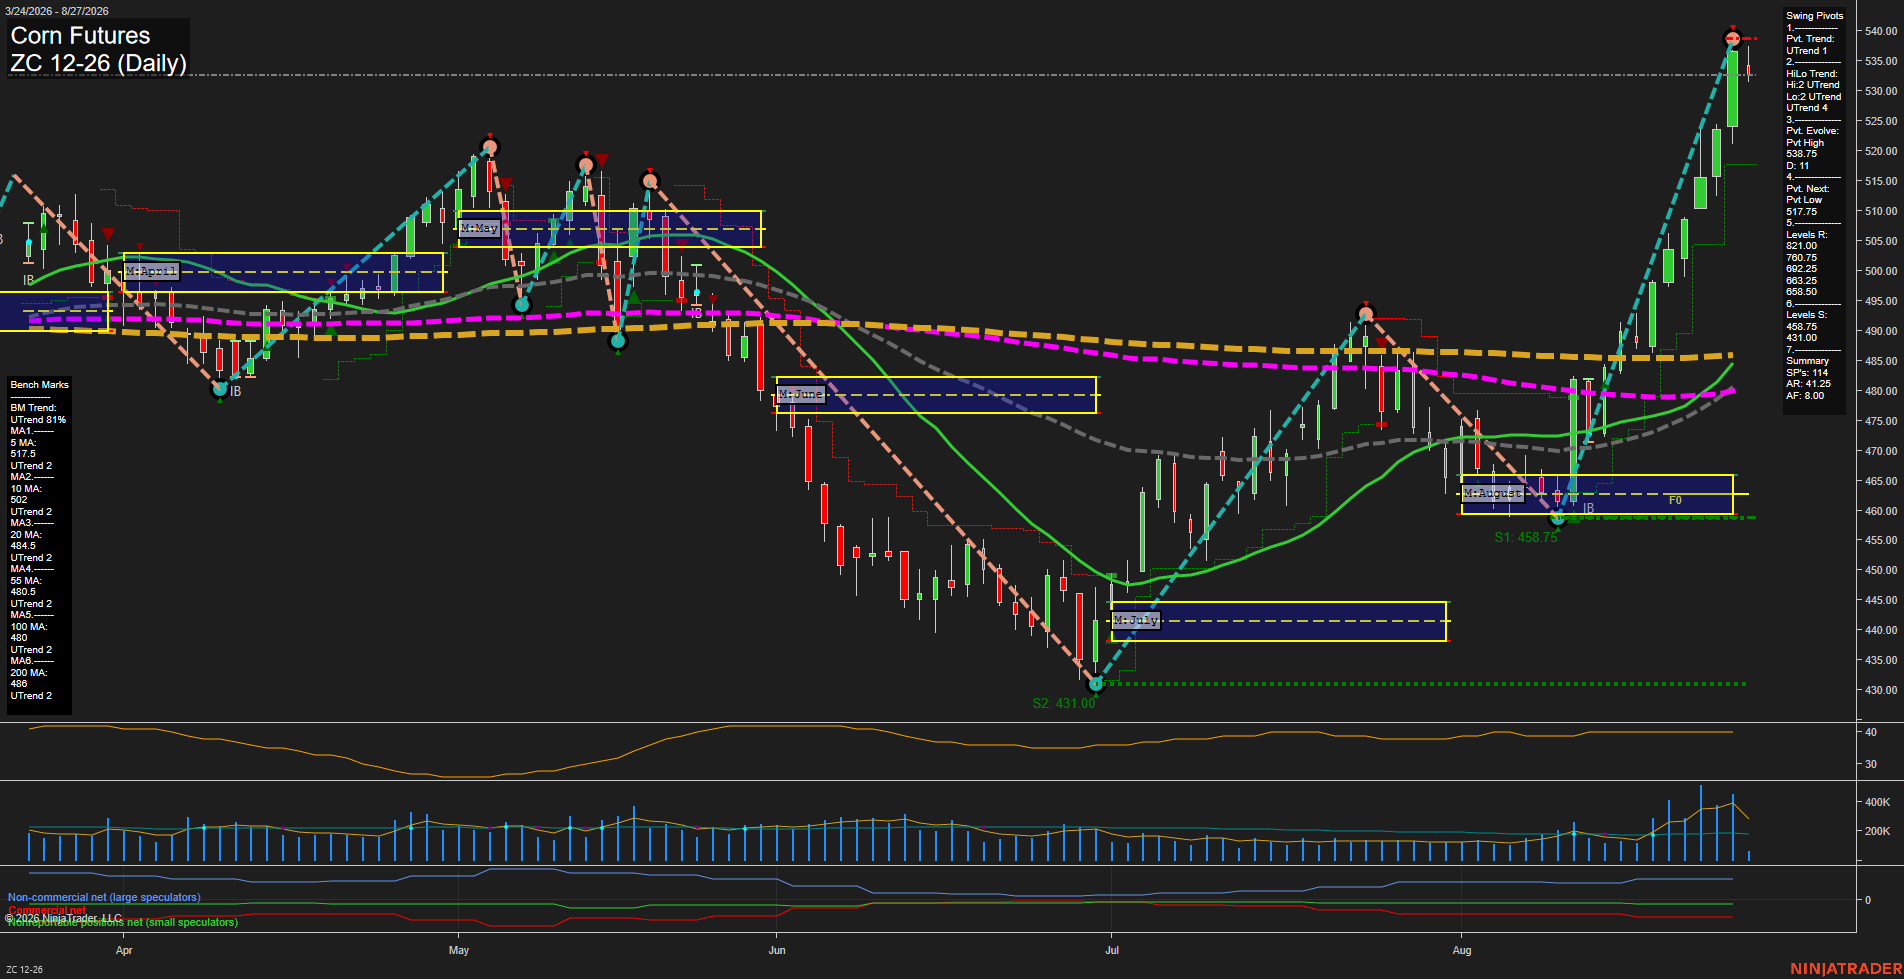
ZC Corn Futures Daily Chart Analysis: 2026-Aug-27 07:13 CT
Price Action
- Last: 535.00,
- Bars: Large,
- Mom: Fast.
WSFG Weekly
- Short-Term
- WSFG Current: 97%
- F0%/NTZ' Bias: Price Above,
- WSFG Trend: Up.
MSFG Month Aug
- Intermediate-Term
- MSFG Current: 182%
- F0%/NTZ' Bias: Price Above,
- MSFG Trend: Up.
YSFG Year 2026
- Long-Term
- YSFG Current: 21%
- F0%/NTZ' Bias: Price Above,
- YSFG Trend: Up.
Swing Pivots
- (Short-Term) 1. Pvt. Trend: UTrend,
- (Intermediate-Term) 2. HiLo Trend: UTrend,
- 3. Pvt. Evolve: Pvt high 538.75,
- 4. Pvt. Next: Pvt low 517.75,
- 5. Levels R: 521.00, 500.75, 492.25, 483.25, 458.50,
- 6. Levels S: 458.75, 431.00.
Daily Benchmarks
- (Short-Term) 5 Day: 517.5 Up Trend,
- (Short-Term) 10 Day: 502.0 Up Trend,
- (Intermediate-Term) 20 Day: 484.9 Up Trend,
- (Intermediate-Term) 55 Day: 480.5 Up Trend,
- (Long-Term) 100 Day: 480.0 Up Trend,
- (Long-Term) 200 Day: 486.0 Up Trend.
Additional Metrics
- ATR: 41.25,
- VOLMA: 252019.
Overall Rating
- Short-Term: Bullish,
- Intermediate-Term: Bullish,
- Long-Term: Bullish.
Key Insights Summary
Price has produced a sharp V-recovery from the August 458.75 swing low, accelerated through the August MSFG range, and extended materially above all benchmark moving averages. Pivot structure is aligned upward across short- and intermediate-term measures, while expanding volume and a rising ATR confirm unusually fast momentum and broad price-range expansion. The latest bar is pulling back from the 538.75 pivot-high area after a near-vertical advance, leaving 517.75 as the next pivot-reversal reference and 521.00 as the nearest established swing-resistance level now exceeded. The chart reflects a strong late-summer breakout phase with price stretched well above the monthly F0% level and major averages.
Chart Analysis ATS AI Generated: 2026-08-27 07:13 for Informational use only, not trading advice. Terms and Risk Disclosure Copyright © 2026. Algo Trading Systems LLC.