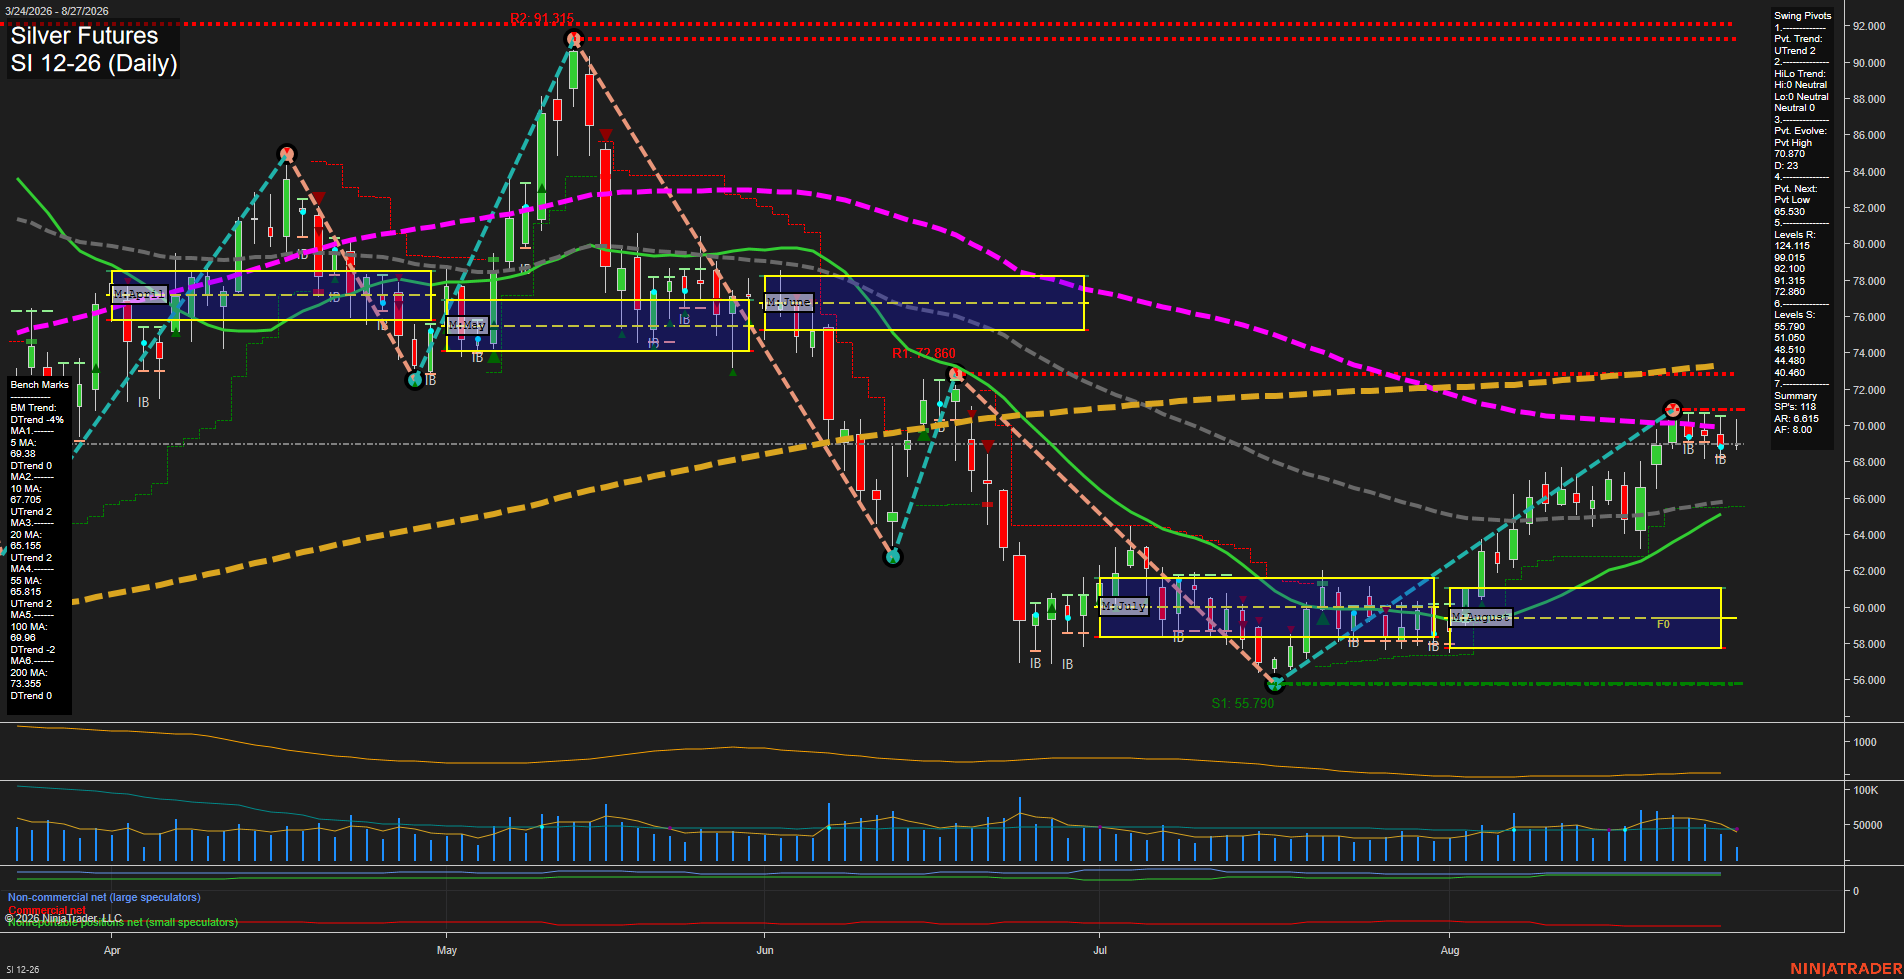
SI Silver Futures Daily Chart Analysis: 2026-Aug-27 07:09 CT
Price Action
- Last: 69.515,
- Bars: Small,
- Mom: Slow.
WSFG Weekly
- Short-Term
- WSFG Current: -19%
- F0%/NTZ' Bias: Price Below,
- WSFG Trend: Down.
MSFG Month Aug
- Intermediate-Term
- MSFG Current: 73%
- F0%/NTZ' Bias: Price Above,
- MSFG Trend: Up.
YSFG Year 2026
- Long-Term
- YSFG Current: -108%
- F0%/NTZ' Bias: Price Below,
- YSFG Trend: Down.
Swing Pivots
- (Short-Term) 1. Pvt. Trend: UTrend,
- (Intermediate-Term) 2. HiLo Trend: UTrend,
- 3. Pvt. Evolve: Pvt high 70.80,
- 4. Pvt. Next: Pvt low 65.530,
- 5. Levels R: 124.115, 99.015, 92.100, 91.315, 72.860,
- 6. Levels S: 55.790, 51.050, 48.510, 44.480, 40.480.
Daily Benchmarks
- (Short-Term) 5 Day: 69.30 Down Trend,
- (Short-Term) 10 Day: 67.705 Up Trend,
- (Intermediate-Term) 20 Day: 65.155 Up Trend,
- (Intermediate-Term) 55 Day: 65.815 Up Trend,
- (Long-Term) 100 Day: 69.910 Down Trend,
- (Long-Term) 200 Day: 73.355 Down Trend.
Additional Metrics
Recent Trade Signals
- 27 Aug 2026: Long SI 12-26 @ 70.34 Signals.USAR-WSFG
- 27 Aug 2026: Long SI 12-26 @ 70.34 Signals.USAR.TR120
Overall Rating
- Short-Term: Bullish,
- Intermediate-Term: Bullish,
- Long-Term: Bearish.
Key Insights Summary
Price is consolidating near 69.515 after a sharp August recovery from the 55.790 swing-low region. The short-term pivot structure remains upward and price is above the rising 10-, 20-, and 55-day benchmarks, although the weekly fib-grid position remains below its F0% reference. The 70.80 pivot-high area and declining 100-day average at 69.910 define nearby overhead congestion, with 72.860 the next major pivot resistance. Intermediate structure has improved through higher lows and an upward August MSFG trend, while the longer-term cycle remains bearish because price remains below the declining 100- and 200-day averages and below the yearly fib-grid reference.
Chart Analysis ATS AI Generated: 2026-08-27 07:10 for Informational use only, not trading advice. Terms and Risk Disclosure Copyright © 2026. Algo Trading Systems LLC.