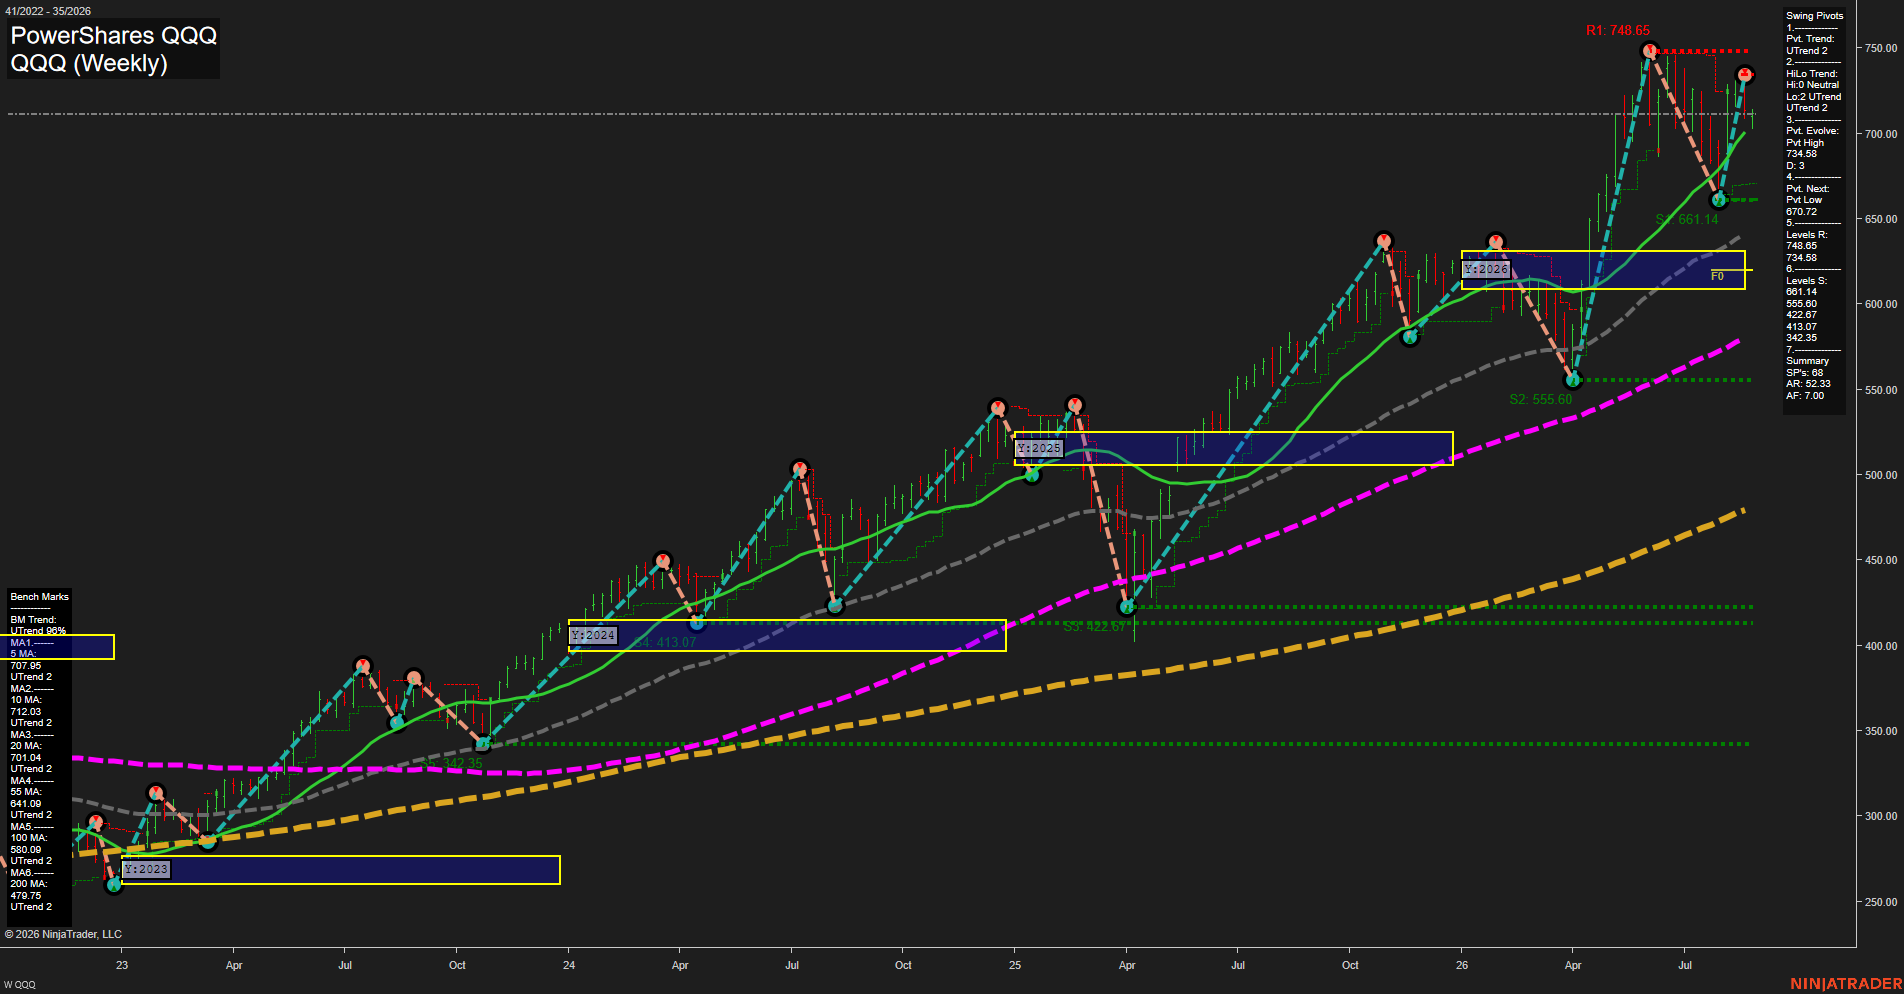
QQQ PowerShares QQQ Weekly Chart Analysis: 2026-Aug-27 07:08 CT
Price Action
- Last: 717.02,
- Bars: Medium,
- Mom: Average.
WSFG Weekly
- Short-Term
- WSFG Current: NA%
- F0%/NTZ' Bias: Price Neutral,
- WSFG Trend: Neutral.
MSFG Month Aug
- Intermediate-Term
- MSFG Current: NA%
- F0%/NTZ' Bias: Price Neutral,
- MSFG Trend: Neutral.
YSFG Year 2026
- Long-Term
- YSFG Current: NA%
- F0%/NTZ' Bias: Price Above NTZ,
- YSFG Trend: Bullish.
Swing Pivots
- (Short-Term) 1. Pvt. Trend: UTrend,
- (Intermediate-Term) 2. HiLo Trend: UTrend,
- 3. Pvt. Evolve: Pvt high 734.58,
- 4. Pvt. Next: Pvt low 670.72,
- 5. Levels R: 748.65, 734.58,
- 6. Levels S: 681.14, 555.60, 422.67, 413.07, 342.35.
Weekly Benchmarks
- (Short-Term) 5 Day: 707.89 Up Trend,
- (Short-Term) 10 Day: 712.03 Up Trend,
- (Intermediate-Term) 20 Day: 701.04 Up Trend,
- (Intermediate-Term) 55 Day: 641.09 Up Trend,
- (Long-Term) 100 Day: 580.09 Up Trend,
- (Long-Term) 200 Day: 479.75 Up Trend.
Overall Rating
- Short-Term: Bullish,
- Intermediate-Term: Bullish,
- Long-Term: Bullish.
Key Insights Summary
QQQ futures-equivalent swing structure remains broadly constructive: price is above every weekly benchmark, the pivot and HiLo trends are both upward, and the 2026 yearly grid is trading above its upper neutral zone. The latest recovery from the 670.72 pivot low has returned price to the upper portion of the range, with 734.58 and 748.65 defining the visible overhead pivot-resistance sequence. The 681.14 support is the nearest structural reference beneath price; holding above it preserves the recent higher-low framework. Momentum is positive but measured rather than explosive, reflecting a recovery leg that is approaching prior highs rather than a fresh broad-range breakout.
Chart Analysis ATS AI Generated: 2026-08-27 07:08 for Informational use only, not trading advice. Terms and Risk Disclosure Copyright © 2026. Algo Trading Systems LLC.