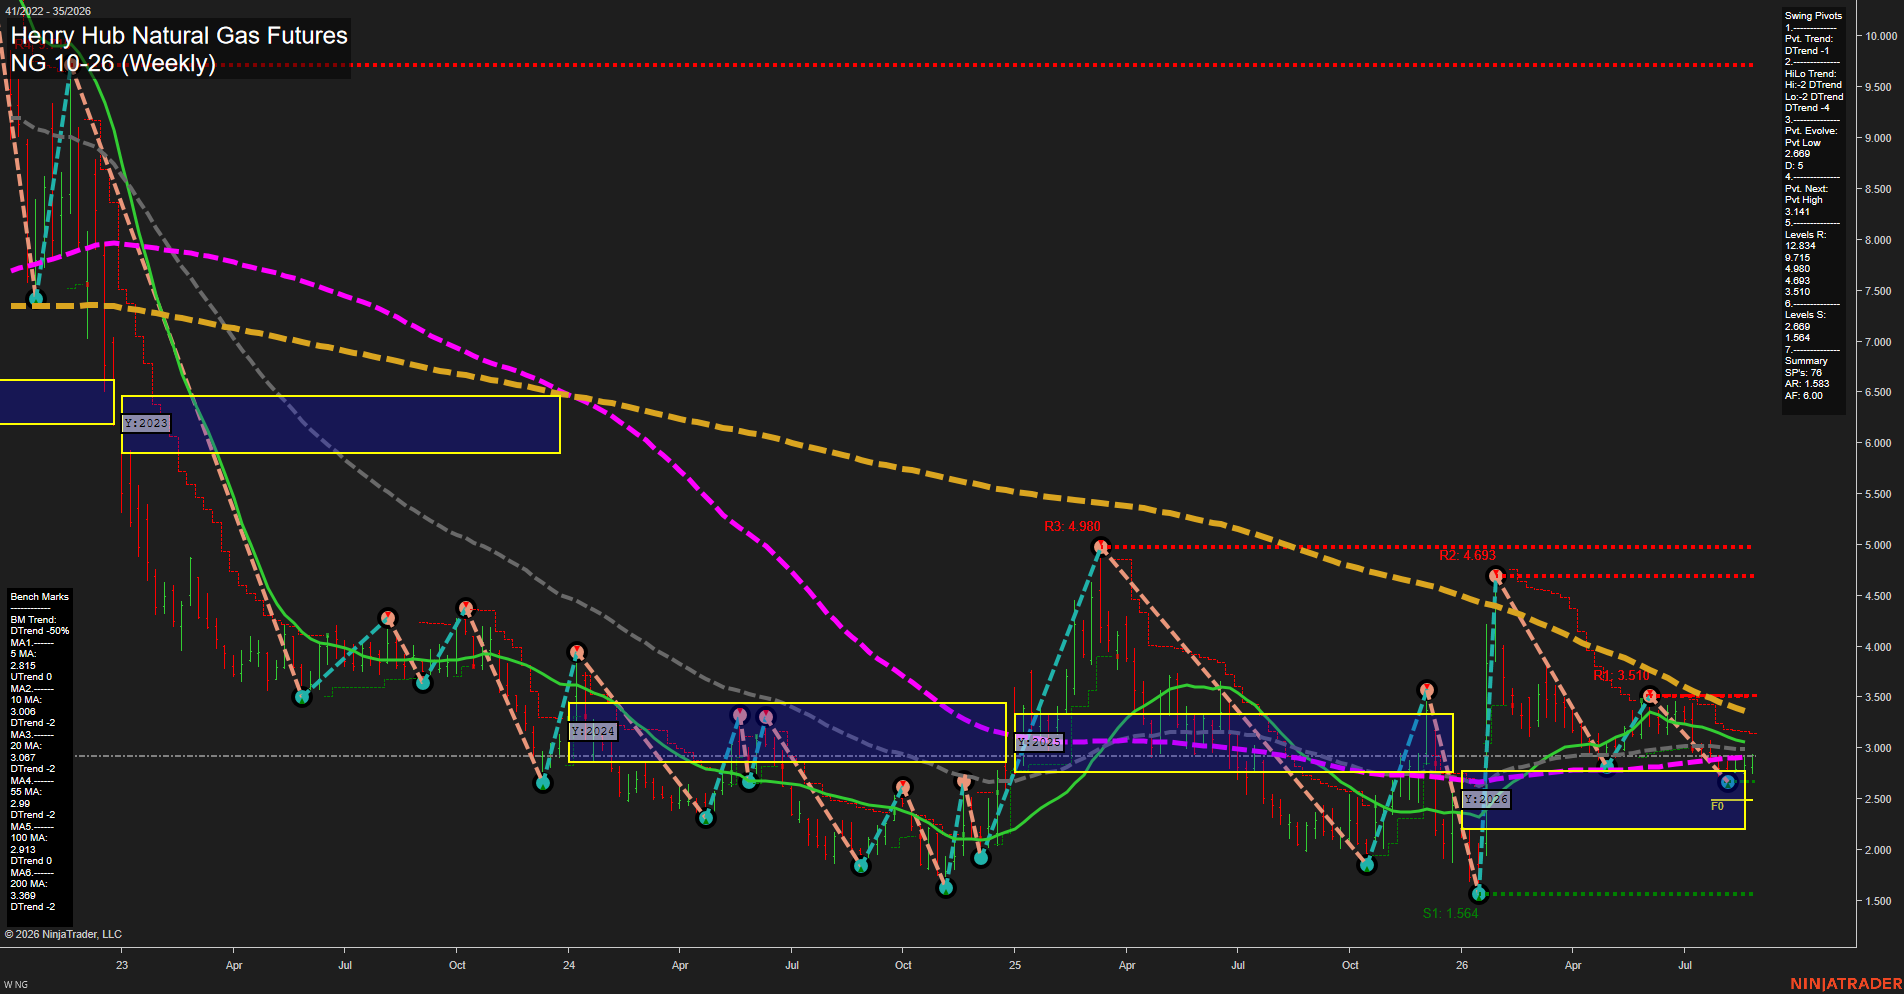
NG Henry Hub Natural Gas Futures Weekly Chart Analysis: 2026-Aug-27 07:07 CT
Price Action
- Last: 2.869,
- Bars: Small,
- Mom: slow.
WSFG Weekly
- Short-Term
- WSFG Current: 65%
- F0%/NTZ' Bias: Price Above,
- WSFG Trend: Up.
MSFG Month Aug
- Intermediate-Term
- MSFG Current: 25%
- F0%/NTZ' Bias: Price Above,
- MSFG Trend: Up.
YSFG Year 2026
- Long-Term
- YSFG Current: 15%
- F0%/NTZ' Bias: Price Above,
- YSFG Trend: Up.
Swing Pivots
- (Short-Term) 1. Pvt. Trend: DTrend,
- (Intermediate-Term) 2. HiLo Trend: DTrend,
- 3. Pvt. Evolve: Pvt low 2.869,
- 4. Pvt. Next: Pvt high 3.141,
- 5. Levels R: 12.834, 9.715, 4.980, 4.693, 3.510,
- 6. Levels S: 2.869, 1.564.
Weekly Benchmarks
- (Short-Term) 5 Day: 2.815 Up Trend,
- (Short-Term) 10 Day: 3.008 Down Trend,
- (Intermediate-Term) 20 Day: 3.067 Down Trend,
- (Intermediate-Term) 55 Day: 2.990 Down Trend,
- (Long-Term) 100 Day: 2.913 Down Trend,
- (Long-Term) 200 Day: 3.369 Down Trend.
Overall Rating
- Short-Term: Bearish,
- Intermediate-Term: Bearish,
- Long-Term: Bearish.
Key Insights Summary
Natural gas is consolidating near the 2.869 pivot-low support after a sharp first-quarter reversal and subsequent lower-high structure. Price remains above the active Fib-grid F0% areas, but the swing-pivot sequence and five of six benchmark averages retain a downward alignment. The 3.141 pivot-next level is the nearby swing inflection, while 3.510 is the first material overhead resistance; 2.869 and then 1.564 define the visible support structure. Small weekly bars and slow momentum indicate compression following the decline rather than a broad upside expansion.
Chart Analysis ATS AI Generated: 2026-08-27 07:07 for Informational use only, not trading advice. Terms and Risk Disclosure Copyright © 2026. Algo Trading Systems LLC.