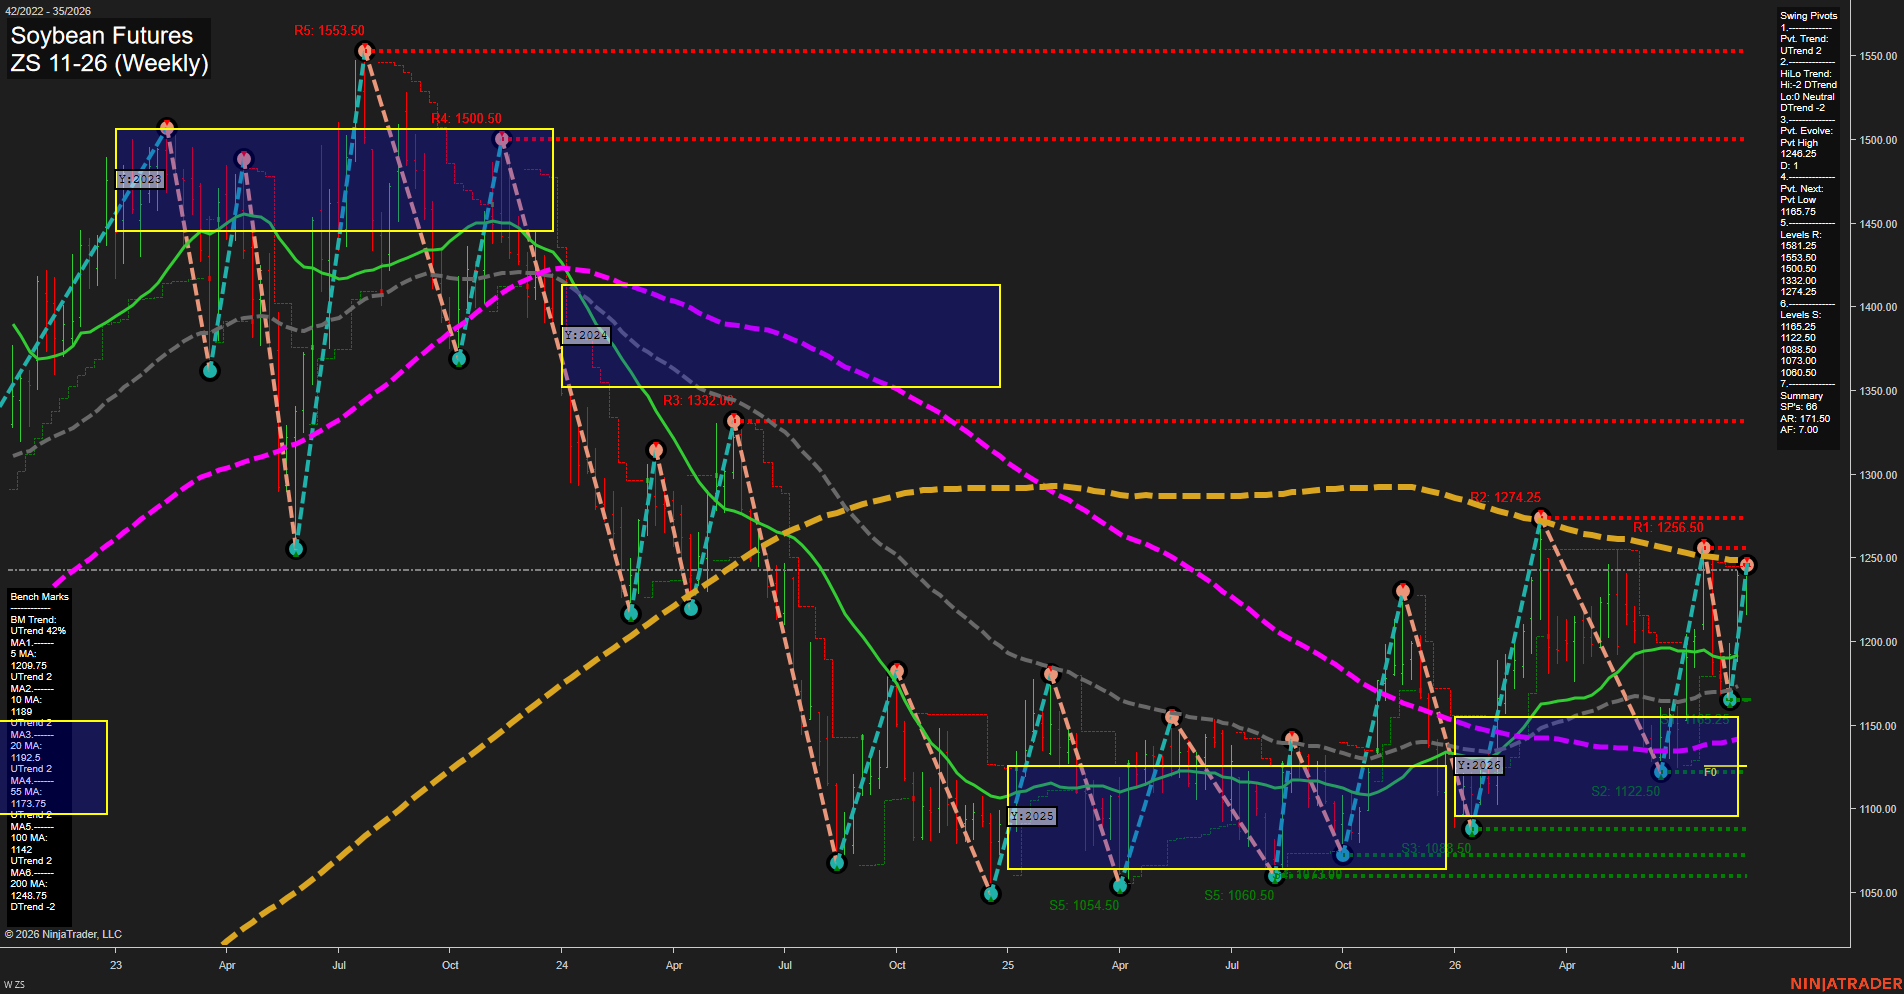
ZS Soybean Futures Weekly Chart Analysis: 2026-Aug-26 07:14 CT
Price Action
- Last: 1244.00,
- Bars: Small,
- Mom: Average.
WSFG Weekly
- Short-Term
- WSFG Current: 9%
- F0%/NTZ' Bias: Price Above,
- WSFG Trend: Up.
MSFG Month Aug
- Intermediate-Term
- MSFG Current: 84%
- F0%/NTZ' Bias: Price Above,
- MSFG Trend: Up.
YSFG Year 2026
- Long-Term
- YSFG Current: 40%
- F0%/NTZ' Bias: Price Above,
- YSFG Trend: Up.
Swing Pivots
- (Short-Term) 1. Pvt. Trend: UTrend,
- (Intermediate-Term) 2. HiLo Trend: DTrend,
- 3. Pvt. Evolve: Pvt high 1246.25,
- 4. Pvt. Next: Pvt low 1165.75,
- 5. Levels R: 1581.25, 1553.50, 1500.50, 1332.00, 1274.25,
- 6. Levels S: 1165.25, 1122.50, 1088.50, 1073.00, 1060.50.
Weekly Benchmarks
- (Short-Term) 5 Day: 1098.75 Up Trend,
- (Short-Term) 10 Day: 1189.00 Up Trend,
- (Intermediate-Term) 20 Day: 1192.50 Up Trend,
- (Intermediate-Term) 55 Day: 1173.75 Up Trend,
- (Long-Term) 100 Day: 1142.00 Up Trend,
- (Long-Term) 200 Day: 1248.75 Down Trend.
Overall Rating
- Short-Term: Bullish,
- Intermediate-Term: Neutral,
- Long-Term: Neutral.
Key Insights Summary
The weekly structure reflects a short-term recovery with price holding above the weekly, monthly, and yearly F0% references and above the rising 10-, 20-, 55-, and 100-period benchmarks. Price is pressing the 1246.25 pivot-high area while the declining 200-period benchmark near 1248.75 and pivot resistance at 1274.25 define an overhead congestion zone. Intermediate structure remains mixed because the HiLo pivot trend is still DTrend despite the recent sequence of higher lows and improving benchmark alignment. The 1165.25 to 1122.50 support band remains the key retracement zone within the 2026 recovery range.
Chart Analysis ATS AI Generated: 2026-08-26 07:15 for Informational use only, not trading advice. Terms and Risk Disclosure Copyright © 2026. Algo Trading Systems LLC.